Featured

A Travel Crisis Grows as We Approach a Hectic Holiday Season

By: Keith Kaplan

4 years ago | News

Many Americans are looking forward to traveling for the holidays to see family and friends, after lockdowns and COVID-19 waves hindered their plans last year. But the airline industry is facing a new problem. The current labor shortage could create another set of challenges for an industry in need of recovery.

Many Americans are looking forward to traveling for the holidays to see family and friends, after lockdowns and COVID-19 waves hindered their plans last year. But the airline industry is facing a new problem. The current labor shortage could create another set of challenges for an industry in need of recovery.

Read Full Article Array
Featured

The Last-Mile Trend is The First Way to Profit After COVID-19

By: Keith Kaplan

4 years ago | News

I spoke about a few of the changes COVID-19 is bringing, such as the shift to working and living remotely and the economic consequences. Today, let’s look deeper at another one of these trends: the future of delivery.

Read Full Article Array
Featured

The 21st-Century Pearl Harbor Moment

By: Keith Kaplan

4 years ago | Investing StrategiesNews

Today, many of us already think of the COVID-19 pandemic as another tragedy that “will live in infamy.” And while the pandemic and Pearl Harbor are very different in many ways, one thing is clear. Historians will look back at both as the beginning of considerable changes to our society and economy.

Read Full Article Array
Featured

So This Is Tesla’s Secret Weapon?

By: Keith Kaplan

4 years ago | News

Today, I want to highlight a few advancements in Tesla’s battery storage business and explain why Tesla is quickly maturing into more than just a car company.

Read Full Article Array
Featured

Another Warning Sign in The Market?

By: Keith Kaplan

4 years ago | EducationalNews

The central bank is poised to start the processing of tapering its balance sheet. However, the market doesn’t seem to be reacting negatively to the news. But I want to highlight yet another warning sign flashing red for the market. Let’s talk about the Fed, and then highlight this “alternative” signal for investors.

Read Full Article Array
Featured

Don’t Get Mad… And Don’t Get Even

By: Keith Kaplan

4 years ago | EducationalInvesting Strategies

This market has been sideways for several months. And this one rule will help you better manage your money.

Read Full Article Array
Featured

What to Make of the Cannabis Bear Market

By: Keith Kaplan

4 years ago | News

If you’re a buyer and holder of cannabis stocks in recent months, you need to read what’s happening in this industry.

Read Full Article Array
Featured

Rule One: Don’t Do This When It Comes to Owning Stocks

By: Keith Kaplan

4 years ago | EducationalInvesting Strategies

When it comes to buying and owning stocks, there is one rule you must follow: Don’t fall in love with the companies you buy. They won’t love you back.

Read Full Article Array
Featured

From Bad to Worse: Alibaba’s Future Looks Uncertain

By: Keith Kaplan

4 years ago | News

If this is a stock in your portfolio, you need to read the cold hard truth that I’m about to tell you. And if analysts are trying to convince you that now is the time to buy Alibaba… you also need to read this. It’s not time to touch this stock yet. Here’s why.

Read Full Article Array
Featured

​​This ‘Liquor Store’ is the Next Great COVID-19 Trade

By: Keith Kaplan

4 years ago | EducationalInvesting Strategies

In 2016, a company you don’t associate with alcohol generated $1 billion in booze sales. Why am I pointing this out? Because this random fact drew my attention to a real buying opportunity.

Read Full Article Array
Featured

5 Ways to Know if a Stock is Overvalued

By: TradeSmith Research Team

4 years ago | Educational

It’s important to be able to recognize the signs that a stock is overvalued. The sooner you become aware of an overvalued stock, the easier you can avoid losing money on an investment.

Read Full Article Array
Featured

A Rock-Solid Trade, Brought to You by the Letter ‘F’

By: Keith Kaplan

4 years ago | Uncategorized

Yesterday, I walked you through the most important letter in finance: F. The letter F starts the term “Five Spot,” slang for a $5 bill. It also starts the word “Franklins,” slang for $100 bills. But yesterday’s article covered the F-score, a mathematical calculation that tells you how strong a company’s balance sheet is based on nine calculations. Today, I…

Read Full Article Array
Featured

The Most Important Letter in Finance

By: Keith Kaplan

4 years ago | Educational

Pop quiz. Who is the most underrated name in the history of finance? Let me make a case for someone you have probably never heard of: Joseph Piotroski. He invented one of the best money-making strategies of all time.

Read Full Article Array
Featured

How to Detect a Market Crash

By: Keith Kaplan

4 years ago | Educational

Advancements in finance and technology have made it easier for ordinary investors to detect an imminent market crash. Today, we’re looking at four different factors you can use to determine when the next market crash may occur.

Read Full Article Array
Featured

Better Than Google? History Says This Stock Is Exactly That

By: Keith Kaplan

4 years ago | EducationalNews

In July 2004, one of the world’s most innovative companies completed its initial public offering (IPO). In fact, this company transformed the way that people buy products. It wasn’t Google, but it probably changed your life. You just might not know it yet.

Read Full Article Array
Featured

Why Do Stocks Go Down When Earnings Are Up?

By: Keith Kaplan

4 years ago | Educational

Earnings numbers aren’t the only thing that investors and analysts are watching during an earnings report. There are several essential things to consider.

Read Full Article Array
Featured

Don’t Let Modern-Day Pirates Pilfer Your Hard-Earned Cash

By: Keith Kaplan

4 years ago | Educational

The Economist has called Gregor MacGregor one of the greatest “confidence” men of all time. His name runs alongside Bernie Madoff and Frank Abagnale (made famous from the movie “Catch Me If You Can.”) Think you’re immune to such a con? It turns out that there are plenty of Gregor MacGregors out there.

Read Full Article Array
Featured

There’s More to U.S. Investing than the NASDAQ and the Dow Jones

By: Keith Kaplan

4 years ago | Investing Strategies

Today, I want to show you how investors can tap into the profit streams of significant international companies, even if they aren’t listed on U.S. exchanges.

Read Full Article Array
Featured

Five Bear Market Rules You Need to Know Now (Before One Strikes)

By: Keith Kaplan

4 years ago | EducationalInvesting Strategies

Historically, the average bear market for the S&P 500 lasts a little less than 13 months and occurs about every six years. But the ensuing rally to record highs over the past 15 months has put many investors on edge. Conditions appear ripe for another bear market.

Read Full Article Array
Featured

The Great American Labor Strike?

By: Keith Kaplan

4 years ago | News

In April, roughly 649,000 people in the retail sector quit their job. That’s the largest single-month departure of Americans from retail jobs since the U.S. government started tracking worker movement more than two decades ago. What’s happening with the labor force requires more profound reflection.

Read Full Article Array
Next Page » « Previous Page

5 Ways to Know if a Stock is Overvalued

By: TradeSmith Research Team

4 years ago | Educational

Editor’s Note: We hope our U.S. readers are enjoying the long weekend! Last week, we sent you an article from one of our excellent editors, Justin Brill, discussing how to identify signs of a bear market. Today, we’re bringing you a guest editorial from our friends at LikeFolio with similar insights on identifying specific stocks to watch carefully. Their data, culled directly from consumer insights, provides for some excellent analysis and a slightly different take. We hope you’ll enjoy it!

Also, as you may have noticed, today’s article is coming to you at a much earlier time slot. We’re trying something new and will send you the TradeSmith Daily around this time every day moving forward, so that you can have the “news of the day” before your day gets started. Keith will be back tomorrow to talk about why oil prices are on the rise.


It’s important to be able to recognize the signs that a stock is overvalued. The sooner you become aware of an overvalued stock, the easier you can avoid losing money on an investment.

It’s imperative to carefully research every stock in which you are considering investing and to know the indicators of inflated valuations so that you can save time, effort, and money.

These five elements of stock assessment will give you a better understanding of how to identify a potentially overvalued stock.

  •  Compare the growth rate to the P/E ratio

Calculate the price-to-earnings ratio of a stock option by dividing the price of a share by the earnings per share and then compare that to the growth rate. If the P/E ratio is higher than the growth rate, the stock may be overvalued. Analyze a stock’s growth rate by looking back over how the earnings have changed on a yearly basis.

The comparison of the two data points allows an investor to gauge the true value of the stock. Avoid investing in stocks with an average growth rate lower than its price-to-earnings ratio.

  • Measure consumer demand on Main Street

Ultimately, a company can only be valuable if it is producing goods and services that others want. 

Companies that are experiencing increasing demand on Main Street will often see increasing share values on Wall Street.

Company earnings reports, same-store sales numbers, and consumer demand data from LikeFolio can give you insight into whether or not the company is likely to grow over the next one to three years.

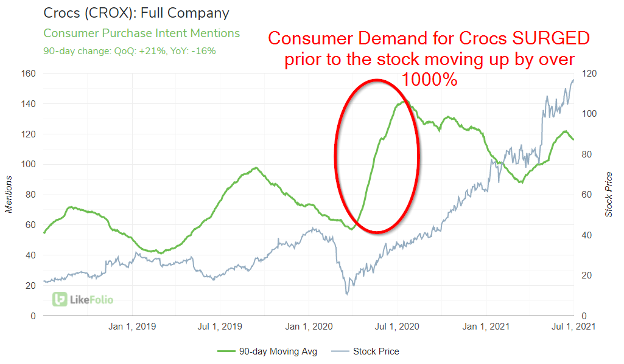
The chart above shows social media purchase intent mentions of Crocs shoes (green line).  Notice how this measure of consumer demand surged at this time last year.

Consequently, so has the stock, which has increased by more than 1,000% since its March 2020 lows.

  • Compare the P/E ratio to competitors

Analysis of the wider market can give a beneficial frame of reference for the valuation of specific stocks.

Identify several competitors to your target stock that compete on a relatively comparable financial footing and compare the price-to-earnings ratio of their stock to the one you’re analyzing.

If your stock’s P/E ratio is significantly higher than most relevant competitors, it’s a good sign that it may be overvalued.

Conversely, if a stock has a lower P/E ratio than most of its competitors, it may be undervalued and worth investing in after further research.

The average P/E ratio of similar competitors is a good general indicator of valuation, but it doesn’t take into account all the factors that could impact an individual stock price, so it should be used in collaboration with further analysis.

  • Evaluate the reputation

The reputation of a company or a stock can have a massive impact on its value.

For example, a stock that has been recently purchased by high-profile individuals can be overvalued by the market.

In general, stocks that are attracting a lot of attention from industry-relevant media outlets and well-known investors can sell for an inflated price due to the hype surrounding them. Take the profile of a stock into consideration when calculating its true value.

Learn to resist the temptation of overvalued stocks with a lot of buzz around them and try to be as objective as possible when investing your money.

If you’re holding a stock that becomes in vogue, it can be a good opportunity to offload it and capitalize on the temporary overvaluation.

  • Watch for any significant sellers

Pay attention to individuals in relevant positions of knowledge and power so you can react if they sell their shares. People with a significant role in a company will generally have prior knowledge of overvaluations and will seek to offload their shares at the best possible time, so follow their lead where possible.

Most directors or executives wouldn’t sell shares in a company with performance and growth they have full confidence in, so it can be a reliable indicator of the health of an organization if they do.

One individual offloading shares is probably no reason for concern, but if a significant portion of influential people start selling, then you should react accordingly.

Identifying the signs of overvaluation can save investors large amounts of investment capital. Knowing when to buy and when to sell is made a lot easier when you have the relevant information at your disposal, so dedicate your time and effort to discovering the true value of any potential investments before committing your money.

While none of these methods are foolproof on their own, they can be very helpful when mixed into your fundamental research process.

A Rock-Solid Trade, Brought to You by the Letter ‘F’

By: Keith Kaplan

4 years ago | Uncategorized

Yesterday, I walked you through the most important letter in finance: F.

The letter F starts the term “Five Spot,” slang for a $5 bill.

It also starts the word “Franklins,” slang for $100 bills.

But yesterday’s article covered the F-score, a mathematical calculation that tells you how strong a company’s balance sheet is based on nine calculations.

Today, I want to discuss an interesting way to trade these companies actively.

You see, Dr. Joseph Piotroski, the founder of the F-score, determined that stocks with a perfect F-score tend to outperform the market.

But buying a lot of a specific stock can cost a lot of money, especially if its shares trade at $100 or more.

So, why don’t we take a look at a way to maximize your gains and limit your risk using a very interesting strategy for an exciting trade.

Trade Like a Poor Man to Get Rich

The trade I want to explain today is known as a “Poor Man’s Covered Call.”

As you know, one of the most conservative trading strategies that you can employ is to sell calls on stocks that you own.

Let’s talk about a stock that has a perfect F-score, sits in the TradeSmith Green Zone, and enjoys upward momentum. While it may be just above the threshold of high risk, it has received multiple upgrades on Wall Street, including a recent target of $141 from JPMorgan Chase.

If you own 100 shares of Lennar Corp. (LEN), trading at $101.78 as of this writing, that position is currently worth $10,178.

You can sell a Nov. 19, 2021, call option with a strike price of $110 for $4.72 (based on Thursday’s price). Since each contract is worth 100 shares, you would collect $472 in premium.

If the stock then gets to $110 by that expiration date, the buyer of the call option would have the right — but not the obligation — to purchase your shares at that strike price.

If the stock hits the strike price and the option is executed, you will collect the difference between $110 per share and your current price of $101.78, plus the premium of $4.72. This represents a per-share gain of $12.94, or $1,294 total.

Of course, if the stock never reaches the strike price, you pocket the premium and generate additional income from your existing position.

But what if you could generate that return without having $10,178 of your portfolio invested in shares to “cover” the trade?

That’s the beautiful part of options.

In The Money, Calls Are the Key

As I showed you earlier, owning 100 shares of Lennar Corp. costs $10,178 (again, as of this writing).

But with options, you can purchase an “in the money” call on the stock at a lower price and own the right to buy that stock by the expiration date.

Yesterday, you could purchase the Jan. 21, 2022, call with a $95 strike price for $1,670.

At any point, you can execute this call option and pay $9,500 (on top of the existing premium that you paid) for 100 shares of LEN stock. But that’s not what this trade is focused on.

Instead, you can use the leverage of this $1,670 and then sell calls on this same stock before your existing option’s expiration date.

The beauty of this is that the returns are nearly identical.

Instead of selling the shares you already own, you can execute the purchase of shares from the call option and deliver them to the trader who purchased your call option.

They receive the shares, but you keep the premium that you generated from the sale of the call option. You will also benefit from the gains achieved by the original call option that you purchased.

The following chart shows the different returns on investment if you sold a “poor man’s covered call” on LEN yesterday. The number on the far right represents the total return possible from the trade.

In the example I just described, an investor would purchase the Jan. 21, 2022, call with a $95.00 strike price for $16.70 per contract. This contract would give them the right — but not the obligation — to buy 100 shares of LEN on or before Jan. 21, 2022, since the strike price is “in the money.”

The investor can then sell the Nov. 19, 2021, call with a strike price of $110.00 for $4.80. Selling this contract would give the buyer the right — but not the obligation — to purchase shares of LEN at $110 if it reaches that strike price.

As you can see, if the stock stays at $102.00, investors will generate a profit.

In addition, an investor can generate maximum gains of $859 should the stock reach $110 and the call is executed (and it remains directly at the strike price).

If the contract that you sold is never executed (doesn’t reach the strike price), you’d still have the long call contract that you bought, with the option to execute the original strike price of $95, and you can sell that call option to close that position.

The maximum loss on this poor man’s covered call is $1,190, which would happen if Lennar stock fell to $59.68. The max loss here is represented by the full cost of the net debit spread ($11.90) received from the simultaneous purchase and sale of these call options.

Now, that might seem like a big loss. But keep something in mind.

If you bought 100 shares of Lennar today and the stock fell from $101.78 to $59.68, you would lose a lot more. It would be a total loss on paper of $4,210.

A poor man’s covered call is just one strategy that you can use to employ less risk and capitalize on leverage to generate strong profits.

It also allows you to take positions on strong stocks like the ones I’ve mentioned with a perfect F-score at a reasonable strike price and reduce your downside.

I’ll be back next week to talk about opportunities and risks for the second half of 2021. I’ll also have a few updates on oil companies.

The Most Important Letter in Finance

By: Keith Kaplan

4 years ago | Educational

Pop quiz.

Who is the most underrated name in the history of finance?

Adam Smith? Warren Buffett? Jim Rogers? Bill Ackman? Benjamin Graham?

I can understand the case for all five of them. And I’m sure you have a name or two that you’d love to send my way (please do, right here).

But let me make a case for someone you have probably never heard of until this minute.

His name is Joseph Piotroski.

And he invented one of the best money-making strategies of all time.

You just likely never knew he was there.

The Doctor is In (The Money)

Piotroski – much like Buffett and Graham – focused on identifying undervalued stocks with significant upside. He started his research as an assistant professor at the University of Chicago and moved on to Stanford University.

For a long time, the perception was that investors should buy stocks that are trading below their “book value” or “net asset value.”

Piotroski vigorously studied Ben Graham’s practice of buying stocks under book value. He found less than 50% of companies that traded below that figure generated positive returns over the next 24 months. So that wasn’t a very good value-investing strategy based on the data. Most stocks saw their share prices decline when trading below that metric.

So, he looked elsewhere. And after more vigorous research, Piotroski created one of the most critical and influential stock-ranking strategies in finance history. Not only does this system help investors identify breakout stocks, but it can be another secret weapon in your arsenal when you use momentum signals through TradeSmith Finance.

Let’s have a look at this strategy.

The F-Score

In 2002, Piotroski authored a paper outlining his famous “F-Score” model.

The model ranks a company’s financial strength based on improving or declining metrics on the balance sheet. According to his research, stocks with higher F-scores outperformed over the next 24 months, while stocks with lower scores underperformed.

The scoring is based on nine specific metrics. Thus, a company can score up to 9 points or as little as 0.

A company will receive a point if it scores the following metrics:

  • Its return on assets is higher than 0.
  • Its operating cash flow is higher than 0.
  • Its return on assets is larger than the ROA figure from the previous year.
  • Its operating cash flow is higher than after-tax net income.
  • The company has reduced its long-term debt as a percentage of assets.
  • Its “current ratio” (a measurement of its current assets to its current liabilities) is higher this year than the current ratio from the previous year.
  • Its total number of shares outstanding is lower than the total in the previous year.
  • Its quarterly gross profit margin is larger than the gross margin in the same period of the previous year.
  • Its sales divided by total assets generated a bigger number than the same calculation for the previous year.

Now, that might feel like it’s a lot to unpack. There are key definitions on the balance sheet that we can define in future issues of TradeSmith Daily. For now, I just want you to know that the F-score is an important metric that can help you identify companies with improving fundamentals.

More importantly, I want to show you how to use it the right way.

Combining F-Scores with Uptrend Momentum

Right now, 55 companies have a perfect F-score and are not trading “over-the-counter” through a broker-dealer network. Instead, these are stocks trading on U.S. exchanges and have dramatically improved their balance sheets over their performance from last year.

Now, you might think that 55 is a big number. But in reality, there are thousands of stocks trading on U.S. exchanges. So, how can we identify a few companies that combine these strong fundamentals with momentum and upside?

You know the answer. We’re going to look for companies that have a perfect F-score, sit in the Green Zone (our buy zone in TradeSmith), are in a Smart Moving Average uptrend, and have low to medium risk. I’ll be honest with you. On the surface, they don’t appear to operate in the most exciting industries in the world.

But they have great balance sheets, kick off tremendous cash flow, and have far less risk than the high-flying growth stocks that remain very volatile.

Here are three perfect F-Score companies that stand out today.

Luther Burbank Corp. (LBC): You’ve already heard me talk about mergers and acquisitions activity in the community and regional banking space. Luther Burbank Corp. is a holding company that operates out of California. It pays a nice dividend and trades at a price-to-tangible book value of 1. This means that the stock is trading at its liquidation value (if the company went out of business today, you’d get 100% of your money back). Should it become an acquisition target, it could easily fetch 1.5 to 1.7 times its tangible book value, making it an optimal buy-and-hold opportunity for investors. The stock is in the Green Zone, pays a 1.92% yield, and has been in a solid uptrend for months. As banking stocks continue to rebound from the post-COVID environment, this is a sneaky way to play the financial sector. Best of all, it has a strong history of stock buybacks, meaning that its executives are always looking for ways to return excess capital to investors.

Sumitomo Mitsui Financial Group (SMFG): Next, we have Sumitomo Mitsui. It is a strong dividend stock that pays a 5.12% yield and has enjoyed improving momentum since December 2020. This Japanese financial company remains under the radar and pays at very cheap multiples, even for a company of its size and region. Shares are trading under $7.00 and look like an outstanding stock to buy, hold, and dividend- reinvest in an improving market in the wake of COVID-19.

Cigna Corp. (CI): Finally, check out Cigna Corp. The health insurance company sits in the Green Zone, operates in an uptrend since December, and has a perfect F-score. Cigna fell off the radar of many investors, and it now trades at an attractive P/E ratio of 10.29 with price-to-sales of just 0.52. This is a very profitable company with solid margins and improving return on equity. Wall Street is very bullish on CI with an average price target of nearly $297, according to TipRanks. That figure represents nearly 25% upside from today’s trading levels.

Remember, we are always in the business of combining new metrics and old metrics to help us improve our conviction. So the F-Score can act as another tool to give you confidence right alongside the powerful screens and tools at TradeSmith Finance.

Tomorrow, I’ll show you how to take a stock like SMFG or LBC to generate additional returns from just their dividends.

How to Detect a Market Crash

By: Keith Kaplan

4 years ago | Educational

Editor’s Note: I’m wrapping up the final details for our big event tonight, so I’ve asked Justin Brill to share with you some of the best indicators of a coming bear market. Justin usually writes our Inside TradeSmith column, all about the best, most effective ways to use our products to best manage your own portfolio. I hope you’ll enjoy his tips on detecting a coming market crash. I’ll be back tomorrow. — Keith

The U.S. financial markets have experienced three significant crashes over the last two decades.

In 2000, the dot-com bubble exploded after stock valuations hit an all-time high and collapsed.

The 2008 financial crisis occurred in the wake of a massive housing and credit bubble that imploded.

And last year, the stock market experienced the fastest bear market on record after the widespread shutdown caused by COVID-19.

With the markets again sitting near all-time highs, many pundits predict that another crash could happen soon.

It wouldn’t be unprecedented for a market crash to occur shortly after a previous one. The 1800s were littered with multiple examples of financial panics and depressions that hammered the U.S. economy (sometimes just a year or two apart).

Fortunately, some things have changed since then. Most important, advancements in finance and technology have made it easier for ordinary investors to detect an imminent market crash.

Today, we’re looking at four different factors you can use to determine when the next market crash may occur.

Stock Valuations

What goes up must come down. When it comes to stock valuations, there is typically a reversion to the mean.

Every stock has a crucial valuation metric known as a price-to-earnings (P/E) ratio. This valuation recognizes the number of years it would take for a company to justify its stock price based on its annual earnings.

Historically, a high price-to-earnings ratio on the S&P 500 has signaled trouble.

As you can see below, this ratio is currently 89% – or more than two standard deviations – above its historical mean dating back to 1950.

It hasn’t been this high since the peak of internet bubble in the late 1990s.

Source: CurrentMarketValuation.com

This next chart shows a version of this metric known as the Schiller P/E Ratio or cyclically-adjusted P/E (CAPE) Ratio.

This version uses a 10-year average of inflation-adjusted earnings to give a more accurate measure of market valuations over long periods of time.

Source: Multpl.com/shiller-pe

As you can see, this ratio hit 37.5 in mid-June 2021. Again, that is the highest level in this metric since the dot-com boom. But it’s also well above the peaks of Black Monday (the day of the 1987 stock market crash) and Black Tuesday (prior to the onset of the Great Depression in 1929).

These are clear signs of a “frothy” market.

However, when you combine this metric with others listed below, you can start to pinpoint the likelihood of a crash with greater precision.

Credit Quality

The U.S. economy operates heavily on consumer and business credit. Banks and other institutions lend money to borrowers to make purchases, start businesses, and engage in other forms of economic activity.

However, history has shown there is a limited pool of qualified buyers. And in nearly every financial crisis, deteriorating credit quality has played a role.

In 2008, for example, the U.S. housing crisis was fueled by banks making hazardous loans and creating additional trading products whose performance was based on the quality of the underlying credit instruments like mortgages and auto loans.

One metric to watch is the yield of high-yield or “junk” bonds. These are corporate bonds rated BBB- or lower on the Standard & Poor’s and Fitch scales, or Baa3 by the Moody’s scale.

Typically, we will see a spike in junk bond yields ahead of economic challenges and ensuing market downturns. This is because investors become extremely cautious about their lending money as the threat of potential defaults begins to rise.

As you can see in the chart below, junk bond yields spiked during the dot-com bust, the 2008 financial crisis, and the onset of the COVID-19 pandemic.

Junk bond yields are currently sitting at multi-decade lows due to the Federal Reserve’s unprecedented monetary stimulus following the COVID crisis last year.

However, a reversal in yields would be a strong signal that trouble is brewing again.

Relative Strength Index

Next, the Relative Strength Index (RSI) can give investors an edge in determining when the market is due for a selloff of some degree.

The RSI is a momentum indicator that measures the rate of the rise or decline in an asset or index to identify “overbought” or “oversold” conditions.

The RSI is measured on a scale of 0 to 100. Readings of 30 or below indicate that an asset is oversold and may be due for a move higher, while readings of 70 or higher indicate an asset is overbought and may be due for a pullback.

The chart below shows the S&P 500’s performance versus its RSI since mid-2016.

As you can see in the dark line across the top of the chart, there is a correlation between significant pullbacks and high RSI. For example, the RSI rose sharply in late 2017 to nearly 80. An ensuing selloff hit the markets at the beginning of 2018.

Similar extremes in the RSI preceded the March 2020 crash as well as the broad-market correction last summer.

Many investors will take gains off the table in overbought conditions and wait for a pullback in such situations.

Insider Selling

Finally, we have a metric known as insider selling.

You don’t usually hear much about this one, but it can be one of the most powerful warning signals in the financial markets.

Insider selling is exactly what it sounds like. It’s when a corporate executive or board member sells their own company’s stock on the open market.

No one knows more about the valuation of a company and the strength of a balance sheet than the corporate officers in charge. So, investors should always pay close attention when these officers are buying or selling their shares.

For example, in February 2020, insider selling of stocks surged as COVID-19 spread. Yet as markets have rebounded and hit new all-time highs this year, corporate insiders have once again been selling their companies’ stocks. In fact, they’ve been selling at a pace not seen since 2008, right before the financial crisis.

It’s also important to note that insider buying can provide the same type of signal when a rebound seems imminent.

Unlike some of the other metrics I mentioned, this information is freely available to the public. Corporate insiders who make informed purchases or sales of their company’s stock must fill out a Form 4 to comply with U.S. Securities and Exchange Commission (SEC) regulations. You can find the forms on EDGAR, the agency’s corporate document registry.

Conclusion

Investors should be wary of another financial crisis. Given the ongoing uncertainties around inflation, stock market valuations, geopolitics, and more, a potential meltdown could happen at any moment.

I encourage you to keep an eye on the warning signs I mentioned above. Only vigilance and diligence will protect you from a nasty downturn in the financial markets.

There are other metrics and tools that can help protect your principal and your profits as well. And this evening, we’ll unveil our No. 1 tool to help you eliminate the stress of investing in volatile markets.

If you want to learn more, be sure to join us tonight at 8 p.m. Eastern to learn a powerful new way to make money in bull and bear markets alike. I promise you don’t want to miss it. Click here to reserve your spot before 8 p.m. Eastern.

Until next time.
 
Stay safe out there.

Better Than Google? History Says This Stock Is Exactly That

By: Keith Kaplan

4 years ago | EducationalNews

In July 2004, one of the world’s most innovative companies completed its initial public offering (IPO).

It was one of the most widely anticipated IPOs in market history. Investors flocked to take advantage of the technological successes that it had. It would go on to create some of the most incredible technologies that consumers use every single day.

In fact, this company transformed the way that people buy products.

But if you think that I’m talking about Google, you’re mistaken.

Google’s IPO was actually in August 2004.

Another company – a global leader in innovation – went public in July 2004.

And it changed your life. You just might not know it yet.

Check This Out

Want to see an incredible chart?

This is the all-time total returns for Google and a little company called Domino’s Pizza since their respective IPOs 17 years ago.

Yes, total returns for Domino’s Pizza – including dividend payments – sit north of 7,000% over the last 17 years.

Google, a company that everyone associates with innovation – is up just 4,790% by comparison.

Now, I’m sure some people are scratching their heads.

Domino’s has been a better stock to own than Google for the last 17 years?

Yes. And that return is well-deserved.

Domino’s is an incredible “technology” company.

About two years ago, there was some bearish chatter around Domino’s stock.

Analysts worried that Domino’s was facing stiff competition from rivals like GrubHub and UberEats.

Domino’s had decided to go it alone when it came to delivery.

The pizza joint did not want to sell its products on popular delivery apps.

Instead, it relied on its history of innovation to win the so-called “Pizza Wars.”

Domino’s has been in the position of fighting off competition for decades.

But people just keep dismissing its popularity and its ability to outperform consistently.

Even during COVID, the company continued to boost same-store growth. In Q1 2021, Domino’s continued its trend of 109 straight quarters of increased international same-store sales growth.

That’s more than 27 years.

So, what is Domino’s doing so well that other restaurants are not?

Mobile First

Domino’s generates 60% of its orders from digital platforms.

Just 10% of its orders are walk-ins.

You don’t get to those levels without early adoption. And Domino’s clearly was in the digital game early.

It was the first major pizza chain to start online and mobile ordering. Back when these platforms began, some analysts scoffed. In their minds, phone orders and walk-in orders were the only way to complete a pizza sale.

But Domino’s has been at the cusp of innovation for decades.

It created the food-warming HeatWave bag back in 1998. Now, these bags are a staple of almost every delivery company in America.

It also created the Domino’s Tracker. I remember people laughing at the idea that you would want to track your food in real-time.

But guess what? This technology is at the center of every single food application that you use today. If it weren’t for Domino’s, you’d be sitting by the window waiting for your delivery driver and shaking a fist at the sky.

Want more innovation? Back in 2015, they made it possible for customers to order food from their watch, from a car stereo console, and even from text messages.

It then created something even more popular before the pandemic. Hotspots – which launched in April 2018 – allow customers to meet their delivery drivers in public places like parks, beaches, and even the local museum. There are more than 150,000 Hotspots locations across the world.

Its latest innovation is even more incredible. And it could be one of the largest drivers of profit margin in the years ahead (no pun intended).

Driverless Delivery

Domino’s latest innovation comes from a partnership with a robotics company called Nuro.

The company is now testing a robot pizza delivery system in Houston, Texas.

That’s right, customers in Woodland Heights can now have a robot drop off their pizza. While it’s en route, customers can follow the robot’s path and get a mobile code to unlock the vehicle upon its arrival.

This isn’t the first time that Domino’s launched autonomous delivery. It tested drone deliveries in London back in 2013.

It all sounds very futuristic. Sometimes the company’s experiments sound downright silly at first glance. But its philosophy on staying out in front of trends and taking risks is why this company has been so successful.

And that success is measured in dollars and cents.

Domino’s has fantastic profitability metrics. It has an operating margin of 17.89%, and net margins are at 11.53%. There isn’t a restaurant in America that would turn down that kind of profit. In addition, we’re starting to see more Wall Street analysts turning increasingly bullish on the stock. One analyst at Longbow Research just hiked a price target to $518. That’s about 11% higher than where the company’s stock sits today.

As always, I turned to TradeSmith Finance to get an assessment on Domino’s stock.

Shares are sitting in our Green Zone (signaling that it’s a buy as of June 21). In addition, it maintains upward momentum and has been in an uptrend since June 18.

When it comes to Domino’s, this is really a technology company hiding in plain sight.

I’ll continue to watch what other innovations they deliver in the months and years ahead.

Why Do Stocks Go Down When Earnings Are Up?

By: Keith Kaplan

4 years ago | Educational

Last Thursday, one of the most important and successful companies in the post-COVID economy reported earnings.

FedEx Corp. (FDX) has thrived due to surging e-commerce demand, handily beating earnings expectations. For its fiscal fourth quarter, FDX earned $1.87 per share. That topped Wall Street analysts’ expectations by a penny.

On revenue, FedEx came in at $22.6 billion. That figure represented a staggering 30% increase in bottom-line revenue from the same time in 2020.

Even more remarkable, that revenue number topped expectations by more than $1.1 billion.

Ahead of the earnings report (on Thursday), FedEx stock pushed higher and higher. It hovered just above $304 per share during the last 30 minutes of trading that day.

After the bell and after FedEx’s blockbuster numbers, however, shares of FedEx plunged.

What gives? This company just reported incredible numbers… yet the stock fell. FedEx isn’t alone in this phenomenon. Today, I want to explain why a stock like FedEx’s falls despite positive earnings.

What Happened with FedEx?

FedEx’s earnings and revenue numbers were great.

But earnings numbers aren’t the only thing that investors and analysts are watching during an earnings report.

There are several essential things to consider. Earnings and revenue are backward-looking. Forecasts are forward-looking.

In the case of FedEx, the company released a few eye-popping warnings that raised red flags about the future. First, the company said it faced a significant rise in costs to address the rising demand for its services. One of the highest is the cost of labor, which has exploded as the economy reopens.

I’ve discussed the ongoing shortage of workers in the U.S. economy. Companies like FedEx are fortunate enough to have ample resources to pay new and existing employees more money (compared to smaller mom-and-pop businesses that don’t have ample finances).

FedEx said that its total operating expenses – the money they use to fund current business practices – increased by 23% year over year.

Simply put, the company was saying that the cost of doing business was going up. And when that happens, rising costs cut into profit margins.

When profit margins fall, investors might have lower confidence in the ability of the company’s stock to continue rising. In addition, lower profit margins can impact cash on hand and dividends. Higher profits will help generate stock buybacks and higher prices. Lower profit margins (or even negative profit margins) can do the opposite.

Pay Close Attention to Guidance

If you’re looking for an illustration of how guidance affects a stock price, let me show you one of the most famous examples.

In July 2018, Facebook (FB) reported earnings. Investors were greatly interested in the future of the company. Facebook was coming off the heels of a major scandal involving Cambridge Analytica over user privacy during the previous presidential election.

During that report, the company issued some incredible numbers. It reported $5.12 billion in net income or $1.74 per share. That beat Wall Street expectations, and it was a massive jump from the $3.89 billion (or $1.32 per share) reported during the year prior.

On revenue, Facebook reported $13.09 billion in sales for the quarter. That figure was a 41.9% increase from the previous year. However, even though the social media giant reported this huge increase, it wasn’t enough for investors.

Based on the stock’s rising price in the weeks ahead of that earnings report, investors expected Facebook to “crush” expectations.

The revenue growth percentage was lower than periods in the past, but the company also warned that this revenue growth would likely slow down in the future.

Within hours of that report, shares of Facebook fell by almost 20%.

The headlines said that Facebook issued “nightmare” guidance by suggesting that user growth would slow down, challenges in advertising would persist, and that expenses would continue to rise.

The selloff is linked to two factors. First, some investors had lost confidence in Facebook’s forward growth prospects.

Second, a lot of investors took gains off the table.

Buy the Rumor, Sell the Fact

One of the other elements that investors must consider is that many traders take profits from trades based on earnings. “Profit-taking” is very common around earnings season. If a company reports strong earnings, a trader might sell before other people can consider selling themselves.

There is a behavioral component to this that everyone must consider. If a trader believes that others will sell and lock in profits based on good news, they will move to sell the stock before others can.

The thinking here is that if the stock drops, the trader can simply repurchase it later at a lower price. If it doesn’t fall, the trader can just take the profits and move on to the next idea.

Longer-term investors shouldn’t be too overly concerned by earnings reports unless the stock falls sharply enough that it triggers a trailing stop. At that point, investors can wait for momentum to return to the stock and step in to purchase it.

However, any investor who struggled with a decision after Facebook’s “nightmare” guidance in 2018 could have used TradeSmith’s guidance. TradeSmith users would have known to sell when the stock entered the Health Indicator Red Zone on July 26, 2018 and wait for a new entry signal, which triggered on March 5, 2019. Shares of Facebook stock are up more than 100% since that time.

The takeaway here is: Keep calm.

I’ll be back to talk about one of the most impressive statistics about Google that you’ll ever see. If you think Google is an incredible company, wait until I show you a more innovative company with far more returns for investors since its 2004 IPO.

Don’t Let Modern-Day Pirates Pilfer Your Hard-Earned Cash

By: Keith Kaplan

4 years ago | Educational

Amelia Island is a pristine stretch of land in north Florida. Anyone who has ever wondered where State Road A1A is (it’s a famous road that ends in Key West and is mentioned in many Jimmy Buffett songs) will find that it begins its first mile in Amelia Island.

Visitors to Amelia Island are treated to lovely beaches, incredible seafood, and one of the most entertaining lessons in finance history.

In 1817, Florida was under the control of Spain.

But a Scottish soldier and part mercenary in South America named Gregor MacGregor had big plans for Amelia Island.

MacGregor claimed Amelia Island in 1817 and temporarily formed the “Republic of the Floridas.” His reign was relatively short-lived. What went wrong? Part of the legend goes that he raised money to invade the island, but his commission spent all the money on luxury goods.

The U.S. Navy annexed Amelia Island months after his little invasion. So, like every other great swindler, MacGregor had to find a new scheme. Accordingly, he created one of the most famous scams in the history of Europe and South America.

MacGregor Returns to Europe

MacGregor returned to Europe after he failed to be King of the Republic of the Floridas. A few years after his Green Cross Flag of Florida fell in December 1817, he went back to London.

He did something that a few scammers like to do to beef up his resume.

He added a phony title to his name. Gregor MacGregor became “Sir” Gregor MacGregor.

In the early 1820s, MacGregor had vast knowledge of South America. He had traveled and fought in Venezuela and Bolivia. Rather than act as a potential ambassador for these new and established nations, he went in a different direction.

He simply made up a country. It was called “Poyais.”

The fictional nation quickly generated incredible interest, especially from investors. That Green Cross flag that once hung over Amelia Island now was the “official” flag of Poyais.

In his pitch to would-be investors and immigrants, “Poyais” was a tropical oasis. He traveled across England and Scotland. He sold land, securing upwards of $1.3 million from his scams over the years. People bought worthless bonds from an invented central bank.

They purchased land certificates, which entitled buyers to property in this new country.

When people arrived in “Poyais,” they found themselves walking through the undeveloped jungle along the Gulf of Honduras. According to various reports, just 60 of the 240 people who immigrated to his jungle paradise survived.

The Economist has called MacGregor one of the greatest “confidence” men of all time. His name runs alongside Bernie Madoff and Frank Abagnale (made famous from the movie “Catch Me If You Can.”)

Think you’re immune to such a con?

It turns out that there are plenty of Gregor MacGregors out there.

Typically, a Ponzi scheme or investment scam isn’t noticeable during a solid run in the markets. It’s when the market starts to plunge that many start to fall apart. The Securities and Exchange Commission (SEC) received many warnings about Bernie Madoff long before his $65 billion scam collapsed.

It was the financial crisis of 2008 that made it impossible for him to keep the Ponzi scheme going. (In a Ponzi scheme, new investors pay into the scheme, and the con artist uses that money to pay off the original investors. When a crisis hits, people start to ask for their money, and the whole thing falls apart.)

What’s the Latest Threat

Today, cryptocurrency Ponzi schemes are all the rage. Two days ago, investigators in India arrested a man for cheating 2,000 investors out of their money in a scam involving cryptocurrencies.

In May, the SEC charged five promoters for marketing an unregulated offering for crypto securities that raised roughly $2 billion from retail investors. Most of those investors lost money when crypto-exchange BitConnect blew up in 2018.

And in May, the SEC charged an Idaho man for allegedly raising $6.9 million for a digital investment pool that didn’t exist. From October 2017, a man named Shawn Cutting told would-be investors that he was an experienced investment adviser.

He claimed that he had more than 450 investors. Despite having no experience – whatsoever – as a financial adviseor, he raised $6.9 million.

What did he do with it? He pulled a Gregor MacGregor and bought lots of luxury goods.

He bought cars, paid for his daughter’s wedding, and fixed up his home.

And he attracted investors with lies. He told investors that they would make more than 50% in a month if they gave him their money. And when investors asked for the money back, he ignored them. The SEC’s complaint against him said that he stopped answering requests in February 2020.

That was the start of the pandemic. That was when these investors likely needed their money the most. That was when the market crashed, and the big lie was revealed.

It took more than three years for his investors and the SEC to catch on to his scam.

It’s a good reminder that you are the last line of defense when it comes to your money.

When I read about Ponzi schemes on SEC.gov, I notice several common themes and threads in all of those stories. Next week, I’ll tell you a few ways to avoid these schemes.

There’s More to U.S. Investing than the NASDAQ and the Dow Jones

By: Keith Kaplan

4 years ago | Investing Strategies

There’s another Cold War brewing.

Last week, I dove into the ongoing tech war brewing between the United States and China. What started under the Trump administration has snowballed under the Biden administration.

Right now, the financial press is hyper-focused on the Federal Reserve, meme stocks, and chatter about Prime Day.

But the story about how U.S. semiconductor companies might lose business in China isn’t front-and-center.

As I noted, Boston Consulting Group said that U.S. semiconductor companies could see their global market share plunge from 48% in 2018 to as little as 30%.

If that’s the case, someone would have to pick up the slack, right?

There are many semiconductor companies around the world. Public semiconductor companies in Japan, Germany, and South Korea all have ample global market share and generate billions of dollars in revenue each year.

But not every one of these companies trades on U.S. exchanges.

So, unless you have access to accounts that let you trade on foreign exchanges, you might think you cannot invest in them.

That’s not always the case.

Today, I want to show you how investors can tap into the profit streams of significant international companies, even if they aren’t listed on U.S. exchanges.

Take a Look at This List

Around the world, many brands have incredible market share in their respective industries. However, they are not listed here in the U.S.

I’m talking about Japanese video game and entertainment giant Nintendo.

Chinese internet and AI behemoth Tencent Holdings…

Iconic television manufacturer Panasonic…

And – the company that could surpass Tesla as the largest manufacturer of electric vehicles in 2023 – Volkswagen, according to company executives.

None of these companies trades on the New York Stock Exchange, NASDAQ, or other centralized exchange. Instead, they trade “Over-the-Counter” (OTC).

Some people don’t know what that means.

And others have an immediate bias when they hear the term.

The perception is that if a stock trades OTC, then there is more risk, or the companies might be shady. Well, it’s fair to be skeptical of a neighborhood.

But it’s not fair to have a bias against every resident. 

OTC simply means that an asset is traded through a broker-dealer network.

In this scenario, the broker-dealer buys and sells assets for its account on behalf of its customers.

This process is straightforward. OTC trading helps investors trade equities, derivatives, and other assets that would otherwise not be available to them depending on several different circumstances (mainly out of investors’ control).

For example, some stocks might not meet specific requirements to trade on an exchange. For example, a stock might trade under $1.00. In order to trade on the NYSE, a stock must be above that important threshold.

OTC stocks also have specific requirements to access certain equities.

Think of OTC stocks a little as you might think of a retail store. A broker needs to have an inventory of these assets for you to have access to them. For these reasons, brokers might require you to pay additional transaction fees or place certain restrictions one what stocks or other assets you can purchase.

There are also additional risks that investors should be aware of.

The biggest risk is that certain OTC stocks might not provide a lot of public information to investors. This is one of the reasons why OTC stocks get a bad reputation.

In addition, OTC stocks tend to have lower trading volumes and larger spreads between the bid and ask price.

However, it’s not challenging to mitigate these risks. Suppose you’re looking to invest in a large, multinational company that trades OTC in the United States.

In that case, you will be able to access the company’s public information through regulators in its home country. In addition, bigger companies that trade with high volumes on other global exchanges will likely have adequate volumes and tighter spreads in a tighter market.

Today, I want to show you a few examples of great companies that trade OTC and what we see from the market.

Let’s Look at Some Interesting OTC Stocks

TradeSmith Finance tracks OTC stocks the same way as it tracks anything listed on the New York Stock Exchange and the NASDAQ. Our platform can tell you the entry signal, smart moving average, and VQ score (to measure volatility.)

As I noted above, there are many semiconductor companies that could build market share if this brewing Cold War accelerates. It just so happens that one of the top 10 semiconductors in the world trades OTC and has a very compelling profile in TradeSmith Finance.

Infineon ADR (IFNNY) is Germany’s largest semiconductor manufacturer with a market capitalization of more than $50 billion. Founded in 1999, the company spun out from its previous parent company, Siemens AG. This is one of the 10 biggest semiconductor companies globally and, as of 2020, has more than doubled its revenue to more than 8.6 billion euros ($10.2 billion in today’s U.S. currency)over the last seven years. When the semiconductor industry is in flux, German companies like Infineon could capture any market share lost by U.S. companies in Asia due to the ongoing “Tech Cold War”’ that I’ve previously discussed. IFNNY stock is currently in the Green Zone and maintains uptrend momentum.

But don’t just focus on semiconductors if you’re looking for an opportunity that trades OTC. Here are two more companies currently trading in the Green Zone (our Buy signal) and experiencing strong momentum.

Mitsubishi Heavy Industries (MHVYF): Mitsubishi is one of the world’s largest engineering companies. Based in Tokyo, Japan, it operates in the aerospace and automotive industries. It manufacturers printers, missiles, tanks, air conditioners, and much more. It’s also one of the largest defense contractors on earth. When the economy is reopening, governments are flashing more stimulus money, and investors are looking for defensive trades in an expensive market, MHVYF stands out. The stock is in the Green Zone and shows uptrend momentum. It’s an attractive stock and a way to diversify away from a portfolio of just U.S.-based engineering and manufacturing firms like General Electric.

OTC Markets Group (OTCM): Finally, what better way to celebrate OTC stocks than to mention the financial market for them. OTC Group is a way to invest in the increasing efforts among investors to invest in companies trading OTC. Rather than betting on one individual company, you’re effectively investing in the entire lot. With OTC stocks gaining popularity and now trending on social media and chat boards like Reddit, OTC Group offers price and liquidity information on the available companies. The stock is sitting in the Green Zone and has upward momentum.

When you think of the stock market, don’t just think that the only places to invest are the New York Stock Exchange or the NASDAQ. There are many exchanges in the United States and thousands of stocks of different sizes and price levels that investors can consider.

The OTC market is one additional way to make money trading stocks. You simply need to know how to research and navigate their price and trend information properly. With TradeSmith Finance, we have you covered.

I’ll be back tomorrow to talk about some recent developments in the market. I’ve received many questions about why stocks are pulling back recently despite successful earnings reports. I’ll discuss this situation soon.

Five Bear Market Rules You Need to Know Now (Before One Strikes)

By: Keith Kaplan

4 years ago | EducationalInvesting Strategies

It didn’t last long, but it sure was damaging.

Last March, investors experienced the first bear market in more than a decade.

This COVID-19-fueled bear market, defined as a decline on the S&P 500 index of more than 20%, was also the fastest and shortest in history. It took just 16 days to fall that quickly.

Meanwhile, the recovery took just 33 days.

The COVID-19 market crash was unprecedented in more ways than one.

Historically, the average bear market for the S&P 500 lasts a little less than 13 months and occurs about every six years.

But the ensuing rally to record highs over the past 15 months has put many investors on edge.

Conditions appear ripe for another bear market.

Stock valuations are the highest they’ve been since the dot-com bubble. The Shiller PE Ratio, a measurement of the average price-to-earnings ratio of S&P 500 stocks, sits at 37.68. That figure is higher than Black Monday in 1987 and Black Tuesday in 1929.

The chart below shows that the Shiller PE ratio is heading into territory not seen in more than 20 years.

Source: https://www.multpl.com/shiller-pe

Then there’s the much-hyped Warren Buffett indicator. This measurement is a ratio of the total stock market valuation compared to U.S. GDP. The figure suggests that the market is extremely overvalued at a ratio of 232%.

Source: CurrentMarketValuation.com

The Federal Reserve is poised to raise rates, with such speculation already punishing growth stocks and companies with significant debt.

Those are just a few warning signals.

Whether the next bear market comes in two weeks or two years, it’s essential to be prepared.

That’s what we’re discussing today: how to succeed in a bear market.

Let’s look at the five Bear Market rules that you need to know today.

Bear Market Rule No. 1: Don’t Become a Day Trader

As bear markets occur, the worst strategy possible is to turn into a day trader.

Day traders attempt to make money by jumping in and out of stocks in short time durations. These trades can last a day, an hour, or even a matter of minutes.

Jumping in and out of stocks regularly based on recent moves will more than likely fuel a losing streak. If you haven’t been day trading in the past, a bear market is not the time to start.

Roughly 80% to 90% of new day traders fail in their first year, depending on which source you cite. Even worse, about 80% of day traders will quit in the first two years, according to Tradeciety.com.

Day trading is very emotional for new participants. And, as I’ve stressed in the past, trading on your emotions is not in your best interest. I stress the importance of steering clear of day trading because such failure rates can destroy your confidence in the stock market as a wealth-building machine. If you’re serious about making money in the market, it’s critical to shift your attention away from day-to-day movements and even month-to-month movements.

That sentiment brings us to our next rule.

Bear Market Rule No. 2: Maintain A Long-Term Focus

Back in March 2020, the days felt longer when investors watched their portfolios stretch deeper and deeper into the red. During those stressful stretches, it’s tough to remember that all bear markets have one thing in common: They all end.

According to the Schwab Center for Financial Research, the average bear market for the S&P 500 tends to last a little less than 18 months. If you recall the 2009 financial crisis, many people worried about the safety and security of their retirement accounts. The people who were buying at market lows could do so because they had available cash on hand. By purchasing index funds and strong companies, investors could build a portfolio on the cheap.

Six years later, patient investors made enormous amounts of profits. This is especially true for anyone who used all of the tools at their disposal to increase their exposure to long-term investing. Bear markets are a good reminder to use company 401(k) matching programs and be patient to wait for a rebound. Those who did were handsomely rewarded in 2009 and 2020. Investors who follow that same game plan will find success in the next bear market.

Bear Market Rule No. 3: Cut Your Margins

One of the biggest unforced errors for investors during bull markets is that they fail to slash their margin accounts when the markets start to fall. When investors use margin, they are effectively borrowing money from their brokerage to invest. They can enjoy the gains from this money, but they are on the hook for everything if the investments decline.

Brokerages can force you to sell your stocks or other falling investments during a process known as a “margin call.” These margin calls typically happen when prices have cratered. There’s no negotiation during a margin call, and it can cost you a lot of money if things go sideways.

Let’s say that you have $100,000 in cash in your account that you use to buy stock. And you have another $100,000 in margin on your account. If we see a 25% pullback during a bear market, a decline could cost upwards of 50% of your initial cash investment due to use of margin. The reason is that the margin capital is not your money. So, the brokerage can reclaim its capital and force you to settle from your original cash investment.

Bear Market Rule No. 4: Separate the Signal from the Noise

One of the biggest disadvantages that investors had over the last 100 years is information inequality. What I mean by this term is the idea that institutions had greater insight into events that were about to transpire than retail investors. But the combination of regulatory understanding and technological progress has helped democratize insights into when a bear market is about to transpire and when retail investors should move to cash.

In the case of regulatory filings, pay close attention to corporate insiders’ buying and selling habits. CEOs and chief financial officers are two of the most reliable sources of knowledge about a company’s short-term and long-term future.

If corporate insiders are selling – and I’m stressing a lot of them all at once – this can signal that Corporate America expects a sharp downturn in the market. In February 2020, we saw insider selling hit nosebleed levels as the markets prepared for a possible shutdown to the economy. On the flip side, corporate buying can be a sign that a recovery is in play. A wave of insider buying transpired when the Federal Reserve said it would provide full support to the markets after the COVID-19 crash.

Bear Market Rule No. 5: Generate Money on Your Long-Term Positions

I’ve explained the value of having a long-term mindset. Investors who use strategies like dollar-cost averaging to build positions during a bear market can achieve incredible gains during a market recovery. But keep in mind that there are other ways to make money off existing long-term positions.

For example, if you’re determined to be a long-term owner of Apple Inc. (AAPL), and you own 100 shares, there are simple, conservative, low-risk strategies to generate income off these positions. I recently outlined one example known as a “covered call.” In this situation, you sell a contract that gives a potential buyer the right, but not the obligation, to purchase stock from you if it goes higher and reaches the “strike price.” I outlined this strategy in TradeSmith Daily, right here.

There are many other ways to generate additional cash during a bear market. Best of all, you can use the cash generated to buy some of your favorite stocks on the cheap.

We’ll discuss additional bear market strategies in the days ahead.

The Great American Labor Strike?

By: Keith Kaplan

4 years ago | News

Aislinn Potts is a 23-year-old aspiring writer and artist based in Murfreesboro, Tennessee. I’d never heard of her until yesterday.

I doubt you had either.

She’s likely never sold a book or painting before. But Aislinn generated one of the most widely read quotes of this week.

She had worked as an “aquatic specialist” – a fancy name for a retail position – at a national pet store chain. She quit that job in April. The job paid $11 per hour.

“It was a dismal time, and it made me realize this isn’t worth it,” she recently told The Washington Post. “My life isn’t worth a dead-end job.”

Potts isn’t alone in that sentiment. We’re witnessing more and more Americans channel their inner David Allen Coe, telling their bosses to “Take this Job, and Shove It,” as the country singer’s song goes.

In April, roughly 649,000 people in the retail sector quit their job.

That’s the largest single-month departure of Americans from retail jobs since the U.S. government started tracking worker movement more than two decades ago.

According to the Labor Department, 3% of the U.S. workforce – or about 4 million workers – put in their “two-week” notice and left their job in April 2021.

Employers reported 9.3 million open jobs in early June, a record for the U.S. economy.

What’s happening with the labor force requires more profound reflection.

The so-called labor shortage will significantly impact retail and hospitality companies that most analysts expected to rebound from the COVID-19 crisis.

Help Wanted!

The Pratt Street Ale House is a small restaurant in Baltimore, Maryland.

It sits about one-quarter mile away from Oriole Park at Camden Yards, home of the city’s Major League Baseball team. It hasn’t been crowded in the area for more than a year, but people are slowly returning to games and nightlife. When you walk in the door, a poster catches your eye.

“We’re Hiring. Starting Bonus Up to $400.”

The restaurant is offering to pay new workers $100 for every month they stay on the job.

Naturally, they had to stretch it over 120 days because they’d have incentivized everyone to quit if they received the bonus after 30 days.

I don’t know about you, but I see signs like this everywhere.

They’re in grocery stores, which – alone – lost 49,000 employees in April.

I’ve seen them on the streets beside nursing homes, which lost 20,000 employees across the nation in April.

You can find these signs at your local wine shop, the bookstore, and every restaurant on the block. I’ll bet that you won’t be able to unsee “Help Wanted” signs now.

Heck, in an economy facing shortages of everything, there could eventually be a shortage of “Help Wanted” signs because they’ve all been purchased and placed in windows.

But let’s take a step back: Why have companies in retail and services – the backbones of the U.S. labor force – faced tough challenges in finding workers?

Initially, the pandemic knocked out stores, restaurants, and related businesses for months. In addition, workers faced steep challenges in finding reliable transportation to work, child care, and reasonable hours as businesses cut back shifts.

But now, the other shoe has dropped.

Is This a Renaissance or a Strike?

The United States has effectively wiped out a decade of labor gains in just the last year. If you look at the graph below from the U.S. Department of Labor , you can see that the workforce participation level has again dropped significantly.

In May of this year, 61.6% of the American labor force was employed. And labor force participation had been in a downward decline for the last two decades.

It has not recovered to pre-pandemic levels, and it looks like it could be a long time before we ever get back to where we were before the 2008 crisis.

Oxford Economics has argued there are four reasons why so many workers sit on the sideline. But, unfortunately, these are listed in no particular order or weight of Americans’ decisions to avoid work.

1.    Would-be employees are still afraid of contracting COVID-19.

2.    Federal jobless benefits that many argue incentivize people to stay at home instead of working.

3.    Child care costs and obligations are keeping people at home (schools remain closed).

4.    Many Americans are deciding to retire earlier than they had previously expected.

The second factor – jobless benefits – have generated the most controversy. Today, 25 Republican-run states have now reduced benefits to incentivize people to return to work. However, Americans aren’t just trying to get any job available for the sake of securing a paycheck.

According to a recent study by Yale economists, researchers found “no evidence that high UI [unemployment insurance] replacement rates drove job losses or slowed rehiring.” Similar studies from the Senate Joint Economic Committee and the University of Massachusetts revealed similar findings.

Something significant has changed.

Getting a job after the pandemic doesn’t appear to be just “about the money” or higher paychecks.

When members of the Federal Reserve warned that the recent jobs report might look a little weird, they weren’t considering a potential element that has shifted the perception of work in America.

The lack of a rush back to jobs might be about something else not considered by Oxford Economics.

Many U.S. workers also appear to want something better than the job they currently have.

Dr. Nancy Brune is the executive director of the Kenny Guinn Center for Policy Priorities in Nevada.

Last week, she argued that labor shortages are tied more to job satisfaction. As a result, many U.S. employees are choosing a new path in the post-pandemic economy, or they’re just staying home.

This is a very significant economic development. Once U.S. companies shifted manufacturing overseas, more American workers turned to the retail, restaurant, hospitality, and other service industry as a means of financial support.

But after decades of stagnating wages and uncertain futures, more Americans are looking for a different career path. A recent Pew Survey showed that 66% of unemployed Americans have “seriously considered” a career change.

Brune has called shifts in American job sentiment a “renaissance” and pointed to shifting trends in education, up-working, and new skills development.

If Brune is correct, we will experience a very rapid shift in reshaping the U.S. economy and its workforce. And even that reshaping faces obstacles.

For example, even if schools reopen in the fall (allowing employees to take a new job), keep in mind that we might have a shortage of child care workers and even teachers. It is a vicious cycle.

We could see a major impact on small businesses – already struggling from the pandemic as they struggle to attract or retain talent.

However, the companies that will survive already have strong balance sheets and enough cash on hand to weather this unpredicted storm. We’ll talk more about how to identify those potential winners soon. But, for now, pay very close attention to the shift in employment trends. This could be one of the most critical financial and social shifts for this economy in 40 years.