Featured

A Travel Crisis Grows as We Approach a Hectic Holiday Season

By: Keith Kaplan

4 years ago | News

Many Americans are looking forward to traveling for the holidays to see family and friends, after lockdowns and COVID-19 waves hindered their plans last year. But the airline industry is facing a new problem. The current labor shortage could create another set of challenges for an industry in need of recovery.

Many Americans are looking forward to traveling for the holidays to see family and friends, after lockdowns and COVID-19 waves hindered their plans last year. But the airline industry is facing a new problem. The current labor shortage could create another set of challenges for an industry in need of recovery.

Read Full Article Array
Featured

The Last-Mile Trend is The First Way to Profit After COVID-19

By: Keith Kaplan

4 years ago | News

I spoke about a few of the changes COVID-19 is bringing, such as the shift to working and living remotely and the economic consequences. Today, let’s look deeper at another one of these trends: the future of delivery.

Read Full Article Array
Featured

The 21st-Century Pearl Harbor Moment

By: Keith Kaplan

4 years ago | Investing StrategiesNews

Today, many of us already think of the COVID-19 pandemic as another tragedy that “will live in infamy.” And while the pandemic and Pearl Harbor are very different in many ways, one thing is clear. Historians will look back at both as the beginning of considerable changes to our society and economy.

Read Full Article Array
Featured

So This Is Tesla’s Secret Weapon?

By: Keith Kaplan

4 years ago | News

Today, I want to highlight a few advancements in Tesla’s battery storage business and explain why Tesla is quickly maturing into more than just a car company.

Read Full Article Array
Featured

Another Warning Sign in The Market?

By: Keith Kaplan

4 years ago | EducationalNews

The central bank is poised to start the processing of tapering its balance sheet. However, the market doesn’t seem to be reacting negatively to the news. But I want to highlight yet another warning sign flashing red for the market. Let’s talk about the Fed, and then highlight this “alternative” signal for investors.

Read Full Article Array
Featured

Don’t Get Mad… And Don’t Get Even

By: Keith Kaplan

4 years ago | EducationalInvesting Strategies

This market has been sideways for several months. And this one rule will help you better manage your money.

Read Full Article Array
Featured

What to Make of the Cannabis Bear Market

By: Keith Kaplan

4 years ago | News

If you’re a buyer and holder of cannabis stocks in recent months, you need to read what’s happening in this industry.

Read Full Article Array
Featured

Rule One: Don’t Do This When It Comes to Owning Stocks

By: Keith Kaplan

4 years ago | EducationalInvesting Strategies

When it comes to buying and owning stocks, there is one rule you must follow: Don’t fall in love with the companies you buy. They won’t love you back.

Read Full Article Array
Featured

From Bad to Worse: Alibaba’s Future Looks Uncertain

By: Keith Kaplan

4 years ago | News

If this is a stock in your portfolio, you need to read the cold hard truth that I’m about to tell you. And if analysts are trying to convince you that now is the time to buy Alibaba… you also need to read this. It’s not time to touch this stock yet. Here’s why.

Read Full Article Array
Featured

​​This ‘Liquor Store’ is the Next Great COVID-19 Trade

By: Keith Kaplan

4 years ago | EducationalInvesting Strategies

In 2016, a company you don’t associate with alcohol generated $1 billion in booze sales. Why am I pointing this out? Because this random fact drew my attention to a real buying opportunity.

Read Full Article Array
Featured

This ‘Market Cap’ Strategy is Crushing the Nasdaq

By: Keith Kaplan

4 years ago | Educational

How many stocks trade publicly on U.S. markets? Various estimates exist. FinViz, a financial visualization tool that I use for charts and graphs, measures 5,739 stocks across different market capitalizations. Today, I want to break down the various classes of stocks (six in all) and explain why each category is essential.

Read Full Article Array
Featured

Is Ark Innovation’s Cathie Wood Repeating Bill Ackman’s $4 Billion Mistake?

By: Keith Kaplan

4 years ago | EducationalNews

Every few years, a new money manager takes the investment world by storm. This manager rides a previous success or prediction into the headlines. Investors pour capital into his or her funds. Today, the “rock star” money manager under pressure is Cathie Wood, the CEO, Chief Investment Officer, and co-founder of Ark Invest.

Read Full Article Array
Featured

Here’s My Latest Update on Walt Disney

By: Keith Kaplan

4 years ago | EducationalNews

On April 13, I said Walt Disney was one of the economy’s most attractive “reopening stocks.” At the time, shares sat a little north of $185 per share. Since April 13, DIS stock has pulled back. It is trading under $169 per share. What happened?

Read Full Article Array
Featured

Here’s What Really Happened to AT&T

By: Keith Kaplan

4 years ago | EducationalNews

On Monday, AT&T Corp. announced it would spin off its Time Warner media assets with Discovery Communications to create a new media giant. AT&T would receive about $43 billion in cash and T shareholders would receive 71% of the new company as part of the deal. Sounds incredible, right? Wall Street was less than impressed with the full details.

Read Full Article Array
Featured

Here’s Why Banking M&A Is Heating Up Again

By: Keith Kaplan

4 years ago | EducationalNews

Last week, an incredible report crossed my desk. With so much happening in the market right now, I want to ensure that you didn’t miss this because this story speaks to a remarkable long-term trend that you can exploit right away.

Read Full Article Array
Featured

Here’s How I Spot Big Winners (Stock Pick Inside)

By: Keith Kaplan

4 years ago | EducationalNews

2020 is the perfect example to showcase how much shifting consumer behaviors can move the needle for publicly traded companies. Now, the pendulum is swinging in the other direction. Travel is resuming, live sports are popping, and consumers are getting more social.

Read Full Article Array
Featured

There’s No Reason Left for You to Ignore This Critical Commodity

By: Keith Kaplan

4 years ago | EducationalNews

Scarcity is the key to investment opportunities in commodities. With water, it’s no different.

Read Full Article Array
Featured

Why You Should Really Be Concerned About the Gasoline Shortage (It’s Not the Gas)

By: Keith Kaplan

4 years ago | News

A cybersecurity attack on the 5,500-mile Colonial Pipeline disrupted the supply chain and flow of driving and jet fuels across multiple states. I’m not getting caught up in the hype. I haven’t panic-purchased gasoline. Instead, I am focusing on why this event happened.

Read Full Article Array
Featured

Here’s a Crisis the Government Can’t Solve

By: Keith Kaplan

4 years ago | News

You may have heard about the semiconductor shortage, but what does it mean for you moving forward? New car supply is down and prices are surging. General Motors is lowering supply, pushing folks to buy vehicles sight unseen, and has even raised prices of SUVs by 20% over the last year. This feels like more bubble-popping coming our way …

Read Full Article Array
Featured

Here is My Prediction on Corn Prices…

By: Keith Kaplan

4 years ago | EducationalNews

In about a month, I predict a new search term will enter Google’s Top 25 most-asked questions: “Why is the price of corn so high?”

Read Full Article Array
Next Page » « Previous Page

This ‘Market Cap’ Strategy is Crushing the Nasdaq

By: Keith Kaplan

4 years ago | Educational

How many stocks trade publicly on U.S. markets?

You’d be surprised by the number.

Some people think “the markets” are limited to the Dow Jones 30, the S&P 500, and the Nasdaq 100. But these are the indexes that create most headlines.

Apple and Microsoft both comprise a large percent of the weight on all three of them. You don’t hear too much about the stocks that aren’t part of these fraternities.

So, let’s try again.

I’m talking about the number of companies on any exchanges or over the counter (OTC). The Nasdaq Exchange, the New York Stock Exchange, the American Stock Exchange, and the other ten U.S. exchanges.

Various estimates exist. TheGlobalEconomy.com states that 4,397 public companies traded in 2018. However, that figure doesn’t include OTC stocks.

FinViz, a financial visualization tool that I use for charts and graphs, measures 5,739 stocks across different market capitalizations.

Today, I want to break down the various classes of stocks (six in all) and explain why each category is essential.

I think you’ll be surprised to find that the largest class of stocks in the market – which drives the S&P 500 and Dow – aren’t the top performers this year.

Defining Asset Sizes

In the financial market, there are six classes of equity assets based on their size.

Here’s what you need to know about each.

Mega-Cap Stocks (24 companies): Despite representing the smallest number of companies, 24 mega-cap stocks compose roughly $16.67 trillion in market capitalization (*all market cap numbers from FinViz are as of May 21, 2021). These stocks have market capitalizations of at least $200 billion and carry significant weight on the performance of the largest indexes. Today’s largest mega-cap stock is Apple (AAPL), with a $2.1 trillion market cap. The stock also comprises 5.2% weight of the S&P 500 and 11.1% on the Nasdaq 100. Other examples of mega-cap stocks include Visa (V) and Mastercard (MA).

Large-Cap Stocks (648 companies): Large-cap stocks represent the largest classification by market capitalization. As of May 21, these 648 contained a total market cap of $34.7 trillion*. These stocks tend to have market capitalizations ranging from $10 billion to $200 billion. Large-cap companies tend to offer a wealth of benefits. They typically provide significant transparency to investors, provide dividends, and have reached the peak level of their business cycle. Large-cap stocks are also more stable and provide more predictable revenue and profit expectations every quarter. Examples of large-cap stocks include Boeing Inc. (BA) and Uber (UBER).

Mid-Cap Stocks (1,047 companies): Representing a total market cap of $7.38 trillion*, mid-cap stocks typically represent companies with capitalizations between $2 billion and $10 billion. These companies generally are at the center of their growth curve. They are actively fighting to expand their profits and their market share. Yet, they come with slightly more risk due to their singular focus. These companies tend to focus on a niche in a target market. Examples of mid-cap stocks include H&R Block (HRB) and Legg Mason (LM).

Small-Cap Stocks (1,804 companies): Representing the largest share of companies on the market, small-cap stocks typically have a market capitalization between $300 million and $2 billion. Small-cap stocks usually aim for higher growth rates. They are typically more targeted by retail investors than large institutions, which might have restrictions that limit their ability to own a large percentage of a company. In addition, small-cap stocks tend to have far less coverage from Wall Street analysts. Examples of small-cap stocks include Gogo Inflight Internet (GOGO) and Sturm, Ruger & Co. (RGR)

Micro-Cap Stocks (1,429 companies): Microcap stocks typically have a market capitalization between $50 million and $300 million. These stocks are typically riskier than traditional large-cap and mega-cap stocks. Typically trading at lower price levels, these stocks offer greater profit potential and greater growth potential. But buyers should beware because volatility is a hallmark of these stocks; they don’t trade on the major indexes. Examples of micro-cap stocks include retail clothing company Express (EXPR) and Lakeland Industries (LAKE).

Nano-Cap Stocks (795 companies): Finally, nano-cap stocks typically have a market capitalization of up to $50 million. Like micro-cap stocks, this category has high growth and profit potential that must be weighed against volatility. Nano-cap stocks are typically categorized as “penny stocks” and should be reserved for investors who have higher-than-average risk thresholds. These stocks are more opaque, less liquid, and very speculative. Examples of nano-cap stocks include SandRidge Permian Trust (PER) and Gulfport Energy (GPOR).

This Class is Crushing the Market in 2021

If you polled investors on which class of stocks by market cap has offered the best returns in 2021, I’d bet that most people will say the mega caps. After all, companies like Apple, Amazon, Alibaba, and Johnson & Johnson generate the bulk of headlines across CNBC, the Wall Street Journal, and other channels or publications.

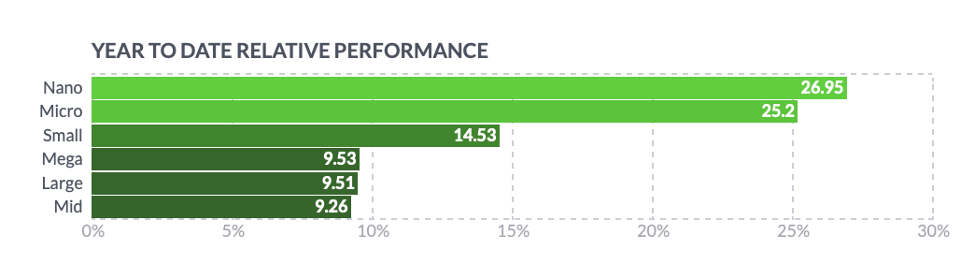
The top performers so far this year have been the class of nano-cap stocks, which were up 26.95% year-to-date through Friday. Meanwhile, micro-cap stocks added 25.2% through Friday. Mid- and large-cap stocks have largely lagged their smaller rivals since Jan. 1.

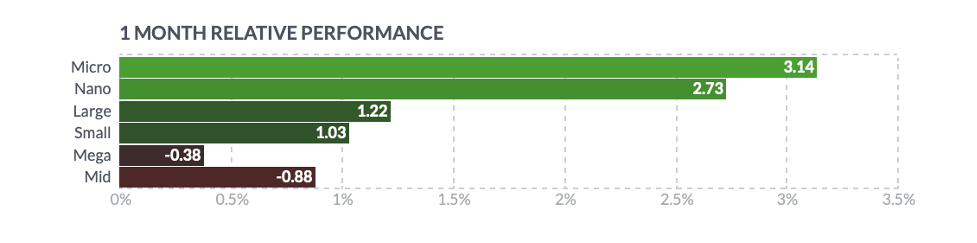
And over the last month, micro-cap stocks have been the top performers. Meanwhile, mega-cap and mid-cap stocks have been in negative territory in the previous 30 days, as seen in the chart below.

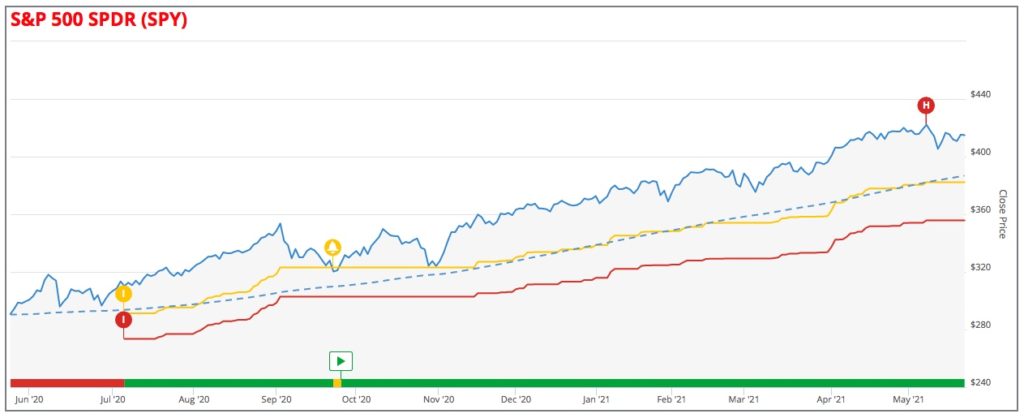
At TradeSmith Finance, we typically measure market momentum by what is happening with the S&P 500 as reflected in the SPDR SPY. But that doesn’t provide the clearest indicator of what is happening at the other end of the spectrum. The S&P 500 does represent trillions of dollars in value. And when it falls into the Red Zone, we move to cash.

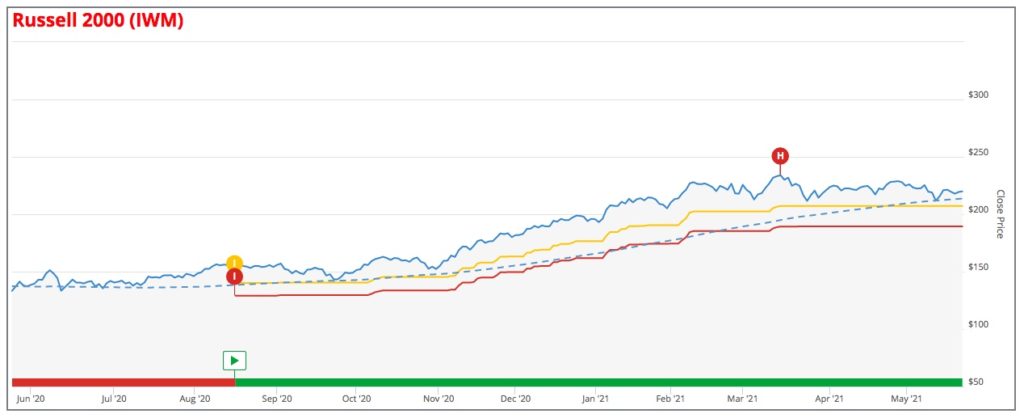
But you can track the performance of small-cap stocks by following or investing in the Russell 2000 ETF (IWM). These are the higher fliers with more volatility and price action. You can use the same indicator and trailing stops to track or trade the IWM.

Or, you can go even deeper with the iShares Micro-Cap ETF (IWC).

This ETF will provide you a broader insight into the health of the entire market. This index selects the smallest 1,000 stocks on the Russell 2000. It’s a crucial indicator and helps you understand what retail investors are doing with their money.

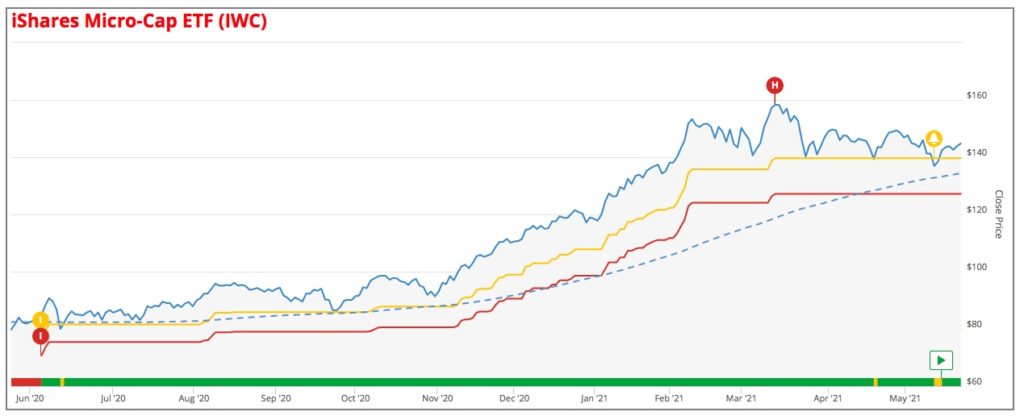
Right now, the SPY, IWM, and IWC are healthy and sitting in the Green Zone. This reading implies a green light for the markets and allows us to dig deeper for investment opportunities.

Tomorrow, we’ll dig deeper into micro-cap stocks and talk about a few companies that offer unique upside in the months ahead.

Enjoy your day.

P.S.  Remember, TradeSmith Finance does track micro and nano-cap stocks, assuming enough historical data exists to prescribe trailing stops. You can type in the stock and find the related indicators to determine if you should buy, hold, or sell any stock, ETF, or other tracked asset.

Is Ark Innovation’s Cathie Wood Repeating Bill Ackman’s $4 Billion Mistake?

By: Keith Kaplan

4 years ago | EducationalNews

Every few years, a new money manager takes the investment world by storm. This manager rides a previous success or prediction into the headlines. Investors pour capital into his or her funds.

And then, fortunes tend to reverse.

Let’s look at a few examples.

Bill Miller beat the S&P 500 every year while leading a value fund at Legg Mason from 1991 to 2005 – 15 years in a row, an incredible achievement.

Miller received incredible praise in the early 2000s and controlled more than $70 billion at his fund’s peak. But fortunes changed when he doubled down on positions in American International Group Inc., Wachovia Corp., Bear Stearns Cos., and Freddie Mac throughout the 2008 financial crisis.

That year, Miller’s fund lost two-thirds of its value. The Wall Street Journal famously wrote an article on the topic in December 2008, with a headline that read: “The Stock Picker’s Defeat.” Miller would ultimately recover, but the shine had dulled on one of the world’s top value managers.

Then came Meredith Whitney. She earned the name Oracle of Wall Street as she predicted problems at Citigroup in October 2007. After her prediction, Citigroup stock slumped, and its then-CEO Charles Prince resigned.

Investors later handed her gobs of cash for a new fund, and she launched a new research firm. Her next big prediction for the markets came in 2010. She argued that municipal bonds would melt down. The prediction never materialized. Years later, Whitney would shut her new fund with too little fanfare.

Then, there’s Bill Ackman. He generated headlines by earning $2.2 billion on a hedge against a sharp downturn in the market in March 2020. Ackman’s success comes after a bit of a quiet period for the hedge fund manager. A few years ago, he lost roughly $4 billion, doubling and tripling down on a collapsing pharmaceutical company called Valeant Pharmaceuticals.

More on that in a minute…

Today, the “rock star” money manager under pressure is Cathie Wood, the CEO, Chief Investment Officer, and co-founder of Ark Invest. Wood was previously the CIO of global asset firm AllianceBernstein.

In 2014, she envisioned a plan to create an exchange-traded fund (ETF) dedicated to companies that bring disruptive technology to the forefront of the economy.

In a bull market, Wood found incredible success. She was named Manager of the Year in 2020. Over the last year, the Ark Innovation ETF surged nearly 175% from March 2020 lows. But the fund has hit an extremely cold streak.

Since mid-February, shares have plunged from nearly $160 to about $103.

And while the fund’s tech stocks are struggling, Wood is making several questionable decisions with investor capital. These mistakes rival those made by Bill Miller and Bill Ackman when their funds faced similar challenges in 2008 and 2016, respectively.

Simply put, these managers failed to ditch their losers and instead did the unthinkable. They doubled down on weakening stocks.

Today, Wood is taking the same risks.

Tracking Bill Ackman

In 2017, TradeSmith published an essay tracking the performance of Bill Ackman and his ill-advised wagers on the failing biotech giant Valeant Pharmaceuticals (VRX). At the time, Ackman’s fund had more than $10 billion in assets.

He had fallen in love with this biotech firm. Yet, the market had a different opinion. If you take a look at the chart below, Ackman bought VRX stock at $180 in March 2015. Shares promptly surged to more than $260.

When a selloff ensued on VRX in the summer of 2015, Ackman could have sold for a very nice profit, using a tool like the Volatility Quotient (VQ) to determine his exit point on the stock.

TradeSmith would have recommended that Ackman exit the stock at $200. That would have provided a profit of around $1 billion.

But that isn’t what happened. The selloff happened. Then Ackman doubled down. He’d go on to buy even more of the stock when it kept falling.

Ackman made the critical mistake of failing to let his losing stocks go.

In the end, he lost roughly $4 billion. His firm lost 20.5% in 2015.

In 2017, Ackman opened up about his mistake and apologized to investors.

But this was just one stock for Ackman.

In the case of Cathie Wood, her fund has been doubling down on multiple stocks that are flashing warning signs.

I’m worried about some of the fund’s recent moves.

Wood Follows the Same Troubled Path

Cathie Wood has been one of the top managers of the last few years. Bloomberg News named her the top stock picker of 2020.

But the recent downturn in the tech market is weighing on her firm’s flagship ETF and several other ETFs it has created to take advantage of disruptive tech trends.

According to Bloomberg, outflows from Wood’s funds totaled nearly $1 billion. Meanwhile, short interest is rising against her funds, while options indicate that more people are betting against her.

The Ark Innovation Fund ETF (ARKK), as we saw in the chart earlier, is squarely in the Red Zone.

Investors are advised to steer clear of this ETF for the time being.

Given that the Innovation Fund is an ETF, it holds a large number of other stocks. Each of these stocks requires greater examination to understand why the ETF’s price is rising or falling. Using TradeSmith Finance, the warning signs are quite revealing.

Based on the portfolio’s 10 largest holdings, the ETF faces extremely difficult market conditions and extremely high risk in its holdings. Below, you’ll find these 10 holdings, the stocks’ tickers, and the relevant TradeSmith Finance indicators.

As you can see, TradeSmith Finance has raised concerns about risk, momentum, and action to take (buy, hold, or sell) on nearly every stock.

Top 10 Holdings – ARK Invest*

Company (Portfolio Weight)TickerTradeSmith Finance Indicators
Tesla Inc (9.99%)TSLAYellow Zone, Sidetrend, Sky High Risk
Teladoc Health (6.02%)TDOCRed Zone, Sidetrend, High Risk
Roku Inc. (5.73%)ROKUYellow Zone, Sidetrend, Sky High Risk
Square Inc. (4.34%SQYellow Zone, Up Trend, High Risk
Zoom Video Communications (4.14%)ZMYellow Zone, Sidetrend, Sky High Risk
Shopify Inc. Class A (4.04%)SHOPGreen Zone, Sidetrend, High Risk
Zillow Group (3.51%)ZRed Zone, Up Trend, High Risk
Twilio (3.47%)TWLOYellow Zone, Up Trend, High Risk
Spotify Technology (3.44%)SPOTRed Zone, Sidetrend, High Risk
Unity Software (3.40%)UN/A
*As of May 19, 2021

Right now, only Shopify (SHOP) is in the Green zone out of the fund’s top 10 holdings (note, we require more data on Unity Software since it hasn’t been trading long enough to have a Health Indicator or VQ ranking). Teladoc, Zillow Group, and Spotify Technology — all in the Red Zone — comprise more than 13% of the portfolio.

While ARKK remains under pressure, Wood’s funds are still buying more and more shares. Wood even sold off nearly every remaining share of Apple (a Green Zone stock) to purchase additional Tesla shares this week.

Teladoc – An Error in Doubling Down

Despite Teladoc falling beyond our recommended stops, Wood has bought more of the stock. On May 5, Wood purchased another $51.15 million in TDOC stock. Since then, shares have fallen from nearly $157 to about $137 (or  12.7%).

Wood could have avoided that other downturn and misallocation of capital if she had used trailing stops and walked away from this struggling stock. Teladoc hit its trailing stop and fell into the Red Zone two days before she bought the next round of stock.

Wood continues to double down on several companies that are struggling.

Recently, Wood boosted the fund’s position on Coinbase (COIN), effectively doubling down on the flailing cryptocurrency exchange.

Although TradeSmith Finance lacks enough data to fulfill all indicators, it would likely sit in the Red Zone due to the stock’s incredible downturn since its initial public offering (IPO).

The lesson here? As I’ve mentioned before, it’s important to have your exit strategy in place, follow that plan, and resist the urge to invest even more in a stock that has proven to be unhealthy.

On Monday, I want to show you a different way to approach the market. You might think that there are only a few different types of stocks that you can or should own. But I’ll reveal the top class of stocks by market capitalization.

And the returns since the start of the year will surprise you.

Here’s My Latest Update on Walt Disney

By: Keith Kaplan

4 years ago | EducationalNews

Not long ago, I was pumped about Walt Disney Co. (DIS).

On April 13, I said Walt Disney was one of the economy’s most attractive “reopening stocks.” At the time, shares sat a little north of $185 per share.

At the time, analysts expressed optimism about all things Disney.

People cheered the reopening of parks. Its Disney+ streaming service had reached record subscription levels. And its portfolio of hotels, cruise ships, restaurants, and film franchises appeared poised for a big bump in consumer spending.

Unfortunately, those catalysts didn’t deliver in late April and early May.

Since April 13, DIS stock has pulled back.

It is trading under $169 per share. What happened?

And, more importantly, what should you do with DIS stock?

I’ll answer both questions.

Macro and Micro Headwinds

Walt Disney recently reported fiscal second quarter earnings.

When discussing the company’s state, it’s always best to go with its most public report. We can expand into broader macroeconomic numbers to determine the headwinds or tailwinds facing the company.

During the bulk of the COVID crisis, Disney had to rely on its digital streaming services to bolster its bottom line. The company owns a stake in Hulu, 100% of the ESPN+ service, and complete control of its Disney+ franchise.

Keep in mind that Disney+ launched in November 2019, just five months before the crisis hit full swing. Its swift growth was nothing short of remarkable.

The company added subscribers in 2020 at a breakneck pace.

Its current subscriber levels are well above initial projections from its launch by several years. However, breakneck growth fuels expectations for further breakneck growth.

When the company reported its second-quarter results, Wall Street analysts anticipated that its subscriber base would hit 109.3 million.

The figure came in at 103.6 million. Yes, that was lower than Wall Street’s lofty goals, but the company showed stronger growth. However, investors should keep in mind that Disney+ totaled just 33.5 million subscribers at the same point in 2020.

I think that Wall Street largely gave a pass on the subscriber tally.

The bigger concern was the fact that its Disney+ pricing fell to $3.99 per use each month. That figure is down from the $5.63 generated during the same period last year. That’s a 29% decline.

Although Disney attributed the decline to a new service launch in India, potential investors should look for this figure to rebound as a factor in any decision to add the stock to a portfolio.

I say “potential investors” because, as of last week, TradeSmith Finance is more cautious about DIS than it was last month. I’ll explain this in a moment.

Park Numbers and Macro Numbers

Disney beat earnings per share expectations for the quarter. Its $0.79 per share was nearly triple the figure expected by analysts ($0.27 according to Refinitiv).

However, revenue fell short of expectations.

The company registered $15.61 billion in revenue; Wall Street expected $15.87 billion. While the Disney+ figure drew the headlines, the reopening of its parks has lagged. 

Disney said that its parks, experiences, and products division saw a 44% decline in revenue to $3.2 billion. Obviously, we can blame COVID-19. Disney’s major parks either shut down or required capacity limits.

In addition, its cruise ships and guided tours are suspended.

It’s hard to generate revenue when your doors are shut. And though the company did reopen two of its California-based parks (including Disneyland) at the start of May, recent ticket sales didn’t count toward the second quarter. We’ll need to wait until the next earnings report to determine whether customers are spending money.

For now, we can look for clues. We can start by looking at the broader spending habits of Americans. Right now, inflation is on the rise. The cost of everything from butter to a used car is surging.

Meanwhile, the U.S. Commerce Department just reported that retail sales for April came in lower than expected. U.S. retail sales came in flat for the month while economists had a consensus forecast of a 1% increase year-over-year.

This should give many retail, services, and travel companies pause.

Spending is not trending in the right direction. In March, consumer retail spending was robust due to stimulus checks and improved consumer confidence.

The 10.7% jump two months ago was the sharpest March increase since 1992.

Wait, Americans Aren’t Spending?

After seeing that April retail figure, I did some digging to understand better why the number is now flat.

A deep dive through multiple pages of Google searches, Wall Street reports, and the hundreds of emails I receive a day ultimately revealed an interesting report.

It came from the Peter G. Peterson Foundation, established by the man of the same name. He was the Secretary of Commerce during the Nixon administration and a co-founder of the Blackstone Group, one of the world’s most prestigious private equity firms.

The company released a report on May 14 that tracked the spending habits of Americans in the wake of the American Rescue Plan. This plan included $850 billion in Economic Impact Payments to citizens.

The goal of such stimulus efforts was to help Americans make ends meet.

Congress wanted Americans to spend this money and pump it back into the economy. The three rounds of direct stimulus primarily targeted lower- and middle-income Americans.

During the first round, 74% of recipients put their stimulus check to work on expenses like “food and rent,” according to the Peterson data. That figure fell to 22% in the second round and just 19% in the third round.

According to the Peterson Foundation, more Americans chose to use that money to pay down debt or threw it into the market or savings account. In fact, during the third round, 49% of respondents said they used the money largely for debt purposes, while 32% said they had saved it.

This should raise some questions about the reopening trade. While I’ve been bullish about the “reopening” trade for the U.S. economy, I want to make sure that I live by the warnings I made recently about confirmation bias.

This is negative news that requires greater investigation into the spending patterns of Americans heading into the summer.

And it could present a challenge for a company like Walt Disney, which is the ultimate reopening company, given its portfolio.

Urge Caution

As I noted above, Walt Disney is no longer in the Green Zone of TradeSmith Finance. The stock fell into the Yellow Zone six days ago, and it currently maintains a Red Zone stop loss of $157.32.

Investors who own the stock should maintain that Stop Loss and continue to monitor the situation. Anyone looking to purchase the stock should wait for the stock to move back into the Green Zone before making their move.

I’ll be sure to include a quick mention if and when Disney makes that move.

I’ll be back tomorrow to discuss Cathie Wood and a few key lessons on what NOT to do if you’re on the losing side of a technology trade.

Enjoy your evening.

Here’s What Really Happened to AT&T

By: Keith Kaplan

4 years ago | EducationalNews

Yesterday, I said I’d discuss some of the biggest myths about the market.

Honestly, that story can wait.

You see, a huge blockbuster happened Monday.

And I need to discuss it. It’s too important to too many investors to not.

You might own the impacted stocks. And if so, read on.

On Monday morning, AT&T Corp. (T) formally announced it would spin off its Time Warner media assets with Discovery Communications (DISCA) to create a new media giant.

AT&T would receive about $43 billion in cash as part of the deal.

And T shareholders would receive 71% of the new company.

It sounds like an incredible deal for AT&T, right?

Well, Wall Street felt otherwise after a bombshell announcement after the deal.

What is it About Time Warner?

What is it about the name “Time Warner?”

Every time this media division gets involved in a deal, it seems to end poorly.

The most famous is the Time Warner merger with America Online.

In January 2000, AOL said it would purchase Time Warner for $182 billion in stock and debt. At the time, it was the largest corporate merger in U.S. history.

It is also considered one of the biggest M&A failures of all time. AOL was a new, digital company with online channels and content. Time Warner was a relic of the past — full of print magazines and legacy media outlets.

The companies struggled to merge cultures. And then the dot-com bubble burst, driving AOL’s market cap from $226 billion to around $20 billion in a short time.

Fast forward to 2016.

AT&T, best known as a legacy provider of phone services and wireless communications, jumped headfirst into the entertainment business.

The company wanted to compete in television and made an ill-advised purchase of DirecTV, which operates satellite television networks.

AT&T paid $48.5 billion for the satellite provider in 2015. However, the second half of the previous decade coincided with a huge shift in consumer sentiment around television. With mobile broadband speeds increasing at a breakneck pace, more consumers were turning to streaming networks. Netflix had 30.4 million subscribers in 2012. By 2017, that figure topped 110 million.

AT&T hadn’t accounted for this digital trend. (They would turn around and sell a significant stake of DirecTV in 2021 to a private equity firm. Now valued at $16.25 billion, DirecTV represents about a $32 billion loss on paper).

AT&T proceeded to do what it does best, with streaming on the rise.

It chased another deal.

In 2016, it announced an $85.4 billion offer for Time Warner and its roster of networks like HBO and Showtime. This deal would propel it into the future and give it a competitive advantage against emerging threats like Netflix and Hulu.

Or at least that was the plan.

The Problem with The New Merger

Initially, Wall Street praised AT&T for spinning off Time Warner into a new company on Monday.

On paper, the deal looks terrific. It would create a new company that combines Time Warner’s digital channel roster with those of Discovery Communications.

The latter company is behind a huge roster of television channels and assets like Food Network, HGTV, TLC, Discovery, Eurosport, and Animal Planet.

In addition, AT&T would receive a payment of $43 billion, which would help offset its losses on DirecTV and help it address other debt.

But dig under the hood, and the details weigh heavier than the headlines.

AT&T has long been an attractive dividend stock among investors. Last year, pundit after pundit told investors to back up the truck and invest in AT&T stock when its dividend touched north of 7%.

What too many investors didn’t know was that AT&T was saddled with debt.

And that debt threatened the health of that promised dividend. The company’s debt topped $160 billion in March 2021, up from $153.8 billion at the start of this year.

Yesterday, the company’s dividend sat at 6.2% due to an uptick in the stock over the last few months, offering great potential to reinvest those dividends and collect more stock.

But this deal would end AT&T’s dominance as a high-yield darling.

Reports indicate that AT&T would have to cut its dividend to support the deal. Before, AT&T had a 12-month trailing dividend payout ratio of 58.26%, according to MarketBeat. The dividend ratio represents the amount of free cash flow that a company pays out as dividends to investors in relation to its net income.

But this deal changes the dividend dynamic. While AT&T shareholders would receive 71% of a “fast-growing media company” in a spinoff, it’s still premature to know how customers will react.

AT&T said that it expects an “annual dividend payout ratio of 40% to 43% of anticipated free cash flow of $20 billion-plus.” That figure could be optimistic as well, as the company continues to face its crushing debt.

AT&T currently pays about $15 billion a year in dividends, according to Kiplinger. But the new deal will see the firm slash that figure down to between $8 billion and $8.6 billion in the year ahead. That’s a 40% cut.

By those calculations, we could see that 6.2% dividend fall to as low as 4%.

Shares of AT&T rose as high as $33.88 on Monday, a 52-week high.

But once details around the dividend cut hit analysts’ desks, the selloff started.

Shares have dropped by more than 14.1% from Monday’s high to 1 p.m. Eastern on Wednesday when shares traded at $29.10.

Naturally, critics have bashed the deal.

Jim Cramer has been the most vocal. He said that AT&T engaged in “destruction of value” and that the spinoff is “not a transformational deal.”

As much as I disagree with Cramer on things, it’s hard to disagree this time.

The Next Threat to AT&T

AT&T has long been a trap for investors. It has immersed itself in promising technologies like 5G, the Internet of Things, and digital streaming channels. However, it has lagged the S&P 500 over the last five years by a wide margin.

In addition, it has been in the Red Zone on TradeSmith Finance since March 12, 2020. At the time, the stock stopped out at a level very similar to today’s price.

It never recovered. Although it might have been an attractive dividend stock, it has not yet received a buy signal from our system.

We will continue to monitor AT&T and its upcoming spinoff. However, for now, we’ll sit tight and be glad we  were able to avoid this drama.

I’ll be back tomorrow with more market commentary. And I’ll have the start of my series on market myths for you very soon.

Enjoy your Wednesday!

Here’s Why Banking M&A Is Heating Up Again

By: Keith Kaplan

4 years ago | EducationalNews

Last week, an incredible report crossed my desk.

With so much happening in the market right now, I want to ensure that you didn’t miss this.

Yes, inflation is surging. Gasoline shortages ruled the headlines. Everything is much more expensive today than just a year ago …

Meats, produce, cars, houses, furniture, RVs … you name it, it’s way more expensive right now.

And on top of that, tensions in the Middle East continue to swell.

But this story speaks to a remarkable long-term trend that you can exploit right away.

Despite the huge challenges facing the economy, this trend will only accelerate over the next decade. Now you have a chance to enjoy the ride.

Let’s dive in.

Don’t Invest in Just M&A

Typically, investors shouldn’t speculate too much on whether or not a company could become a takeover target.

One should invest in a sound organization. It should have strong fundamentals, a strengthening balance sheet, great products and services, and a growing customer base.

Any mergers and acquisitions (M&A) deal should be considered a bonus.

It is a reward for investing in a company that another firm wants so badly that it will pay a big premium for the stock.

But – if you’re going to speculate on consolidation – there is one industry that has consistently delivered blockbuster deals for decades: the banking industry.

Here’s the report I mentioned above.

In April, the industry announced 19 bank mergers and acquisitions, according to S&P Global. That figure is the largest one-month total for deal-making since before the COVID-19 crisis started.

Now, not a lot of people spend time thinking about bank mergers. And, let’s be honest, banking isn’t the most exciting business in the world.

But did you know that the industry has been consistently consolidating at a roughly 3% to 5% annual pace since the mid-1980s?

The industry has gone from 14,496 FDIC-insured banks in the U.S. in 1984 to 4,518 FDIC-regulated banks at the end of 2019.

By comparison, Canada, our neighbor to the north, only has six banks across the country.

April’s uptick in deals is positive for the industry. It’s a sign that the industry consolidation has recovered. But anyone with knowledge of this space knows that this consolidation trend has plenty more room to run.

Four Real Trends Behind Bank Consolidation

Let’s take a look at why this trend isn’t going to slow down any time soon.

There are four key trends driving consolation in banking in 2021 and beyond.

  1. Deposit Growth Gold Rush: Banks require customer deposits for lending and growth of their balance sheet. However, only two ways exist to increase these deposits by a significant amount. A bank can either benefit from robust local economic growth and/or strong demographic migration from new customers. Or, the bank can purchase another one. Right now, banks in places like Florida and Texas (where population growth is expanding) have benefited from the first trend. M&A remains the best option for banks where customer growth has stalled or economic growth remains muted.
  • Weak Succession Plans: Large financial banks like JPMorgan and Goldman Sachs benefit from their brand and prestige. Young bankers flock to these large financial institutions to launch their careers. Smaller regional or community banks have struggled to cultivate and retain talent. Many boards of directors at banks with less than $1 billion under management exited in the wake of the 2008 financial crisis. Departures by those remaining could accelerate after the COVID-19 crisis comes to an end.
  • Tax Reform and Public Policy: The last decade of public policy has created stable conditions for greater M&A activity. The Tax Cuts and Jobs Act created more favorable tax conditions to bolster bank balance sheets and boost cash for potential deals. In addition, a 2018 provision that modified the Dodd-Frank Act of 2010 has also been a factor in driving M&A. Specifically, the rollback raised a critical threshold for bank holding companies that were deemed “systemically important financial institutions” from $50 billion to $250 billion. Previously, banks with more than $50 billion in assets required greater oversight, high compliance costs, and increased reporting. This provision change gave banks fewer reduced oversight costs and greater access to capital for the purposes of M&A activity.
  • Cybersecurity and Digital Banking Costs: Finally, the ongoing threat of hacking events has accelerated in the last two decades. The federal government has increased regulatory oversight to not only protect banking clients, but also to ensure that no bank acts as a backdoor vulnerability to the Federal Reserve’s systems. These regulations come at a significant cost to smaller banks, which traditionally spend less on cybersecurity. However, it’s not just the cost of cybersecurity that remains inhibitive. Smaller banks also lack the required capital to compete with larger rivals in mobile banking, online partnerships, and other digital benefits.

Two Ways to Ride the Banking M&A Wave

What good is a trend if you’re not able to trade it?

Below, here are two different ways to play this ongoing trend.

  1. Home Bancshares (HOMB): Headquartered in Conway, Arkansas, Home Bancshares is one of the most active buyers of community banks across the nation. It  operates similar to a hedge fund riding this M&A trend. Over the past five years, it has been extremely active in buying, with multiple additions to its portfolio. The stock has remained in the Green Zone on TradeSmith Finance for more than five months. It also maintains strong momentum in this market. That said, the stock does provide a higher category of risk based on its VQ of 34.37%.
  • StoneCastle Financial (BANX): The corporation operates as a closed-end fund that specializes in investments in the community banking space. These financial institutions typically have less than $2 billion in assets under management and are likely more attractive takeover targets than their larger competitors. BANX trades at a slight discount to its net asset value (NAV) due to its structure and investor sentiment. BANX might not have significant upside potential, but it does pay a rock-solid dividend of 7.1%. BANX has been in the Green Zone for more than 10 months. However, momentum has stalled in recent months. It currently trades more as a buy-and-hold option for investors seeking yield as an alternative to upside appreciation.

Tomorrow, I’ll discuss one of the biggest myths in the financial markets. You don’t want to miss it.

Here’s How I Spot Big Winners (Stock Pick Inside)

By: Keith Kaplan

4 years ago | EducationalNews

Editor’s Note: Today, I’ve asked our friends at LikeFolio to write a guest editorial for the TradeSmith Daily. If you’re not familiar with LikeFolio, they use proprietary technology and an exclusive contract with Twitter to mine more that 500 million tweets per day to determine consumer sentiment and purchase intent for more than 300 public-facing companies. The results give them insight that, when married with the tools of TradeSmith, can give you an enormous advantage. Enjoy (and I’ll be back tomorrow). — Keith

Let’s face it, hindsight makes picking winners seem obvious.

Once you’re looking in the rear-view mirror, all of the factors leading up to a strong company performance are clear.

But hindsight is a day late and a dollar short.

That’s why it’s important for investors to have foresight and an edge.

Because the truth is, the signs of incoming success are there long before everything seems to “click.”

At LikeFolio, we specialize in spotting these signs.

How?

By tapping into the power of social media data to determine consumer demand and happiness, in real-time.

Today I want to share with you the process we use to spot tomorrow’s big potential winners, before they become darlings of Wall Street. 

And I’ll even use a real example from the fashion industry to do it.

First Step: Identify Big Shifts in Consumer Macro Trends

2020 is the perfect example to showcase how much shifting consumer behaviors can move the needle for publicly traded companies.

Just think about how the pandemic impacted the way we work — via Zoom Video Communications (ZM) — what we do for fun — binging on Netflix (NFLX) — and even how we exercise — via Peloton (PTON) or other at-home alternatives.

Now, the pendulum is swinging in the other direction.

Travel is resuming, live sports are popping, and consumers are getting more social.

What do all of these have in common?

Consumers need something to wear.

Check out how these trends in retail apparel are developing:

Consumer mentions of shopping for new clothes have increased +17% YoY and are hitting multi-year highs.  And that’s before things really open up.

Building on this, consumers are showing a preference for a certain type of apparel… and this time it’s NOT yoga pants.

Check out demand for Designer Clothing (think luxury brands):

Now that we have identified two compelling consumer macro trends, let’s dig deeper and look at the players in this space.

Second Step: Find Companies That are Outperforming Peers in Consumer Demand & Happiness (but May Not Be the Biggest Player on the Field

Three names that specialize in some form of luxury retail (and operate online) are Poshmark (POSH), Farfetch (FTCH), and Revolve (RVLV).

To get a view of how well consumers are reacting to these companies, I like to plot them all on the same chart against each other:

Now we can dig in and see which company is standing out from the pack.

I’m guessing you already see where this is going, because it’s so intuitive.

The x-axis represents consumer demand growth, or what we call Purchase Intent.

How many consumers are talking about completing a purchase on the platform now versus last quarter?

The y-axis represents Consumer Happiness.

How happy were consumers during their interaction with the brand or company?

Put both of these metrics together, and you could spot something special.

And look who’s there — all alone in the top-right corner, exhibiting both demand growth and happy customers.

Revolve (RVLV) is an e-commerce platform specializing in fashion, that also has a specialized luxury lens: FORWARD.

Feels like everything is starting to click, doesn’t it?

While RVLV may trail peers when it comes to overall mention volume, consumer demand is growing, happiness is high, and it is being propelled by major macro tailwinds. In addition, RVLV has been in the TradeSmith Green Zone for more than 11 months and is in an uptrend.

On its last report, RVLV handily beat EPS and Revenue projections, and the company noted acceleration into the current quarter:

“Our top-line trends saw substantial acceleration as we entered March increasing from the low single-digit growth we experienced in January and February. Then as vaccines started to roll out, restrictions eased, [and] additional stimulus payments were made by the federal government [so] demand increased significantly. The strong close to the quarter continued into April with growth of over 100% compared to April 2020 and over 30% compared to April 2019. “

Despite a strong report and initial reaction, shares of RVLV are trading more than 30% lower than previous highs, creating a unique opportunity for investors.

Don’t you love it when consumer insights data brings everything so clearly into focus?

There’s No Reason Left for You to Ignore This Critical Commodity

By: Keith Kaplan

4 years ago | EducationalNews

What’s the first thing you picture when I mention “Buffalo, New York?”

Its National Football League (NFL) team, the Buffalo Bills? Spicy chicken wings? Blizzardy weather?

If you’re local, you might say the annual Turkey Trot race.

For me, it’s nearby Niagara Falls State Park.

Consider the more than 700,000 gallons of water that flows over the park’s massive waterfalls every single second.

People in areas near Buffalo are fortunate. They can rely on a constant source of fresh water for drinking, boating, bathing, and hydropower.

Other places in the United States are not so lucky.

At a time when many investors are worried about the market’s health and stretched valuations, I want to overstress the value of water as an investment.

Through rain and shine, water businesses are highly profitable and offer a defensive hedge against inflation and economic downturns.

Lessons from the Colonial Pipeline

As we wrap up this week’s series on commodities, consider this takeaway.

Americans take certain commodities for granted.

We don’t seem to consider the convenient access we have to inexpensive commodities and products in comparison to the rest of the world.

We assume gas stations will always have gas and stores will always have milk. 

Americans took recent shortages of ketchup packets and chicken wings in stride.

But what happens when they can’t fill their car’s gas tank?

We just found out.

As I said yesterday, recent gas hoarding across the East Coast was absurd.

People were filling up plastic gas cans and even garbage bags.

At first, I couldn’t imagine what scenes would look like if the situation involved a lack of access to drinking or bathing water.

But then, I remembered, similar hoarding of plastic water bottles happens anytime a hurricane or tropical storm approaches the Atlantic Coast.

And like the Colonial Pipeline and its fuel supplies, American water supplies are equally vulnerable to cybersecurity events.

Florida recently experienced a near-devastating attack to a local water supply.

In early February 2021, a hacker gained access to a water treatment plant’s network in Oldsmar, Florida. For a moment, the hacker hiked the levels of sodium hydroxide – better known as lye – in the local water supply to 100 times higher than normal.

If the plant operator hadn’t noticed the changes or had stepped away from the controls, the results could have been deadly. The threat of cyberattacks heightens an already growing challenge to bring clean water to a growing global population.

The World’s Most Precious Resource

Scarcity is the key to investment opportunities in commodities.

With water, it’s no different.

In 2008, Andrew Liveris, former CEO and chairman of The Dow Chemical Co., offered his thoughts on its investment potential.

“Water is the oil of the 21st century,” he said.

Many retail investors overlook water. It’s not a flashy commodity. It feels like it’s in constant abundance. I can turn on a tap and the faucet could run for days.

However, it’s been a favorite investment of billionaires, wealthy families, and investment banks for years. The late T. Boone Pickens once secured a large amount of rights to the Ogallala Aquifer, a massive underground water supply that stretches from Texas to South Dakota.

The family of former President George W. Bush owns nearly 100,000 acres of land in Paraguay that conveniently sits atop the Guarani Aquifer, one of the largest underground water reserves in South America.

Big water-rights investments by banks like JPMorgan, HSBC, and Goldman Sachs have prompted fears about “water barons” cornering the global supply.

This consolidation of water rights comes at a time when access to fresh water is waning. Ongoing industrialization and pollution, increased agriculture, and greater human consumption have created large shortages around the world.

Areas lacking access to water include China, Egypt, India, Pakistan, and parts of the western United States.

That’s right, places in the U.S. are running out of water.

America Is Running Out of Water

We might see images of snow hitting Texas. We’ll witness large tropical storms dump torrential rains across the Atlantic and Gulf coasts. Louisiana alone receives more than 60 inches of rain per year, according to National Geographic.

We can look at the Great Lakes (the source of 20% of the world’s surface freshwater) and believe we have abundance of freshwater in the U.S.

But we don’t.

Scarcity of water is as simple as supply and demand. As supply decreases, demand in the U.S. alone is expected to surge.

Americans already use an average 80 to 100 gallons of water per day, according to the United States Geological Survey.

And with the population swelling, certain regions will experience greater threats to their water supply.

In 2019, the journal Earth’s Future issued a startling projection. It suggests that half of America’s 204 freshwater basins might not meet monthly demand by 2071.

That might seem like quite some time before we feel significant effects. But that same journal noted that 83 of the basins could experience shortages as early as this year.

The threat of increased scarcity puts the onus on companies to meet rising challenges. We will require more infrastructure, more innovation, and greater access to new resources to address rising demand.

This can create remarkable opportunities.

The Water Watch List

If you’re interested in investing in water, you’re in good company as I noted earlier.

There are various ways to invest in the growing infrastructure, utility, and treatment of this precious resource. Let’s look at three companies in three categories that stand out.

Water Rights Companies: These companies own the rights to abundant water resources in places around the United States. One that stands out is Vidler Water Resources (VWTR). Vidler owns water rights, land, and infrastructure along the Colorado Basin. Its assets are in or near three fast-growing (and very thirsty) cities: Reno, Nevada; Phoenix; and Las Vegas. They literally sell water in the desert to towns and municipalities. Vidler is in the TradeSmith Green Zonewithin , and trades under $10 per share.

Water Utility Firms: Utility and infrastructure companies will be vital to the future of the nation’s water supply. American Waterworks Co. (AWK) controls more than 53,000 miles of pipelines across the United States. It also owns and operates more than 150 wastewater facilities, 75 dams, 1,100 wells, and 609 water treatment facilities. It has more than 3.5 million customers who rely on its services to deliver clean water to homes, military bases, and other facilities. The company will likely continue to expand its footprint beyond 16 states as this industry consolidates. Right now, AWK is in the TradeSmith Red Zone. Add it to your watch list, and consider waiting until it reaches the Green Zone. This can be a healthy, long-term investment in vital water infrastructure.

Bottled Water: In 2018, bottled water represented 25% of total beverage consumption in the United States, according to Statista. The reliance on and convenience of bottled water remains a major factor in the growth of this industry. Primo Water Corp. (PRMW) is a Tampa-based firm that owns a large portfolio of bottled-water brands. These include Crystal Springs, Mountain Valley, and Deep Rock. The company has 50 manufacturing sites across North America. The stock remains in the Green Zone with solid momentum in today’s market.

The competition and innovation in the water supply chain will heat up in the years ahead. Water is essential no matter how high inflation runs or how ugly the markets might be. This is a safe industry that typically provides solid dividends, intriguing upside, and a fascinating dive into our growing and changing demographics.

Next week, I want to talk to you about three of my favorite letters in finance and how you can use them to identify incredible trades and protect your portfolio.

Why You Should Really Be Concerned About the Gasoline Shortage (It’s Not the Gas)

By: Keith Kaplan

4 years ago | News

The pictures are stunning.

Americans lined up in cars at gas stations. Families filling up 5-gallon gas cans and stuffing them into their SUV trunks.

Some people are even trying to carry off the gasoline in trash bags and plastic bins.

Let me repeat this, as I saw the video with my own eyes …

There were people putting gasoline into plastic bags, trash bags, tote bins, etc. 

It was the most dangerous thing I’ve ever seen. I mean, people are sloshing explosive materials in their cars and homes. 

That won’t end well.

This was yesterday, in 2021. I’m not recanting the events from the 1973 OPEC oil crisis.

This is happening right now along the East Coast of the United States.

A cybersecurity attack on the 5,500-mile Colonial Pipeline disrupted the supply chain and flow of driving and jet fuels across multiple states. 

Some gas stations started running out of gasoline. In a week when we’ve learned about shortages of corn, chicken, semiconductors, truckers, ketchup packets, and other products, gasoline started a real panic.

Americans started hoarding gas like they did toilet paper at the onset of COVID-19.

And the online memes repeatedly referenced the film Mad Max, which centers around a dystopian world where warring gangs fight over limited fuel.

I’m not getting caught up in the hype. I haven’t panic-purchased gasoline. With the pipeline coming back online this week, the shortages will clear up.

Instead, I am focusing on why this event happened.

Then, as a buy-and-hold investor, I want you to understand why one industry creates incredible opportunities for us.

Here’s the Skinny on the Hack

Why did it happen in the first place? At first glance, one might assume that foreign actors are attempting to shut down parts of the U.S. energy grid to disrupt the economy.

That’s typically a good guess in a world that now focuses on cyberwarfare.

And the White House denies Russian hackers are responsible for this event.

Sometimes the simplest explanation is the real reason why hackers attacked this pipeline.

They want money.

The cyberattack likely didn’t aim to disable the pipeline permanently.

A criminal group known as DarkSide engaged in what we now know was a “ransomware attack.”

A ransomware attack works like this.

A hacker attacks a device or network with malware. They might do so by sending an infected or spoofed email to an unsuspecting person at a company.

This malware then encrypts or locks files on the system. The attack makes the system inoperable, and all of the data on the network is inaccessible.

The hacker then demands a ransom – typically Bitcoin or another cryptocurrency – in exchange for releasing the data. The victim pays the fee to receive a key that will decrypt the compromised data. 

This practice is now extremely common in today’s digital world.

A Hacker’s Paradise

Neil Chatterjee, a commissioner on the Federal Energy Regulatory Commission, called this week’s attack on the Colonial Pipeline a “wake-up call.”

But anyone who has paid attention to this threat has known about this ransomware practice for years. The Tennessee Valley Authority, the nation’s largest publicly owned utility firm, checked one billion cyber threatseach day… in 2019. 

One single, successful attack could be the difference in maintaining power service to 153 power companies and more than 10 million people in Tennessee.

But it’s not just the power grid that has been ripe for attack.

Hackers have locked out entire towns and cities from critical networks.

In Baltimore, where some of our offices are located, hackers attacked the city’s servers and demanded 13 Bitcoin in exchange for the passwords to restore them. During the period that Baltimore’s systems remained down, real estate agents could not complete property transfers. The city also couldn’t issue water bills to citizens with its payment system compromised.

Baltimore ultimately paid the ransom.

Even my children’s school system was hacked, and they couldn’t use their devices for months during virtual learning.

These things are a mess and wreak havoc on society.

Similar attacks have hit Greensville, N.C., and Atlanta.

Then there’s another growing target.

The growing victims of these attacks have been small-business owners across the United States. Especially those with lots of customers and relevant data they need to make a sale.

For example, think about owning a car dealership and having all of your customers’ records locked out. Since many people don’t make copies of their data, they are prime targets for ransomware attacks.

Big companies, government agencies, and small businesses are all highly susceptible.

It only takes one spoofed email or piece of malware to infect an entire network.

And it’s becoming more costly than ever. The Department of Homeland Security’s Cybersecurity and Infrastructure Security Agency put a price tag on ransomware attacks in 2020. All told, hackers received more than $350 million in ransom payouts in 2020.

The Takeaway

There are two critical takeaways from this event. First, the decentralization of Bitcoin – typically the ransom of choice– can face more regulatory scrutiny.

Because Bitcoin remains anonymous, there is little way to identify the recipient after a ransomware attack. When events like this happen, the anonymity of the payment can draw sharp responses from regulators and cryptocurrency critics.  

But there’s a much bigger trend at play. Cybersecurity remains the backbone of the U.S. economy in the 21st century. In boom times and downtimes for the economy, spending on cybersecurity will increasingly grow.

President Joe Biden has announced an all-government response to enhancing cybersecurity. That will require not only the deployment of government agencies, but also significant capital allocation to the industry.

The government can’t address this alone. It will take dozens of publicly traded companies in cyberspace to identify new threats and protect the U.S. economy, power grids, and other critical infrastructure.

We’ll discuss a few of the companies that are leading that charge in the days ahead.

In the meantime, be safe out there. Please don’t put gasoline into anything other than your car’s gas tank or an approved storage container meant for that purpose – the kind you’d use to fill up your lawn mower.

Here’s a Crisis the Government Can’t Solve

By: Keith Kaplan

4 years ago | News

In late 2019, I bought a new SUV. It was a first model year, early purchase kind of thing.

Little did I know it would turn out to be a lemon. It’s been at the dealership for over a month for a repair they keep attempting to make.

Outside of work travel, I haven’t been driving all that much during the pandemic. However, the economy is reopening. Interest rates remain low. And my family is ready to hit the road for vacation this summer. We simply need one thing: A reliable SUV.

I’d been looking for a reasonable new car for several months. I’ve checked out all the buyer websites. I’ve made a few phone calls.

Back in 2008, we bought a GMC Acadia. It had its problems, but it was a great vehicle for our family. So I went to test drive a 2021. But I wasn’t ready to hear the news about the GMC Acadia I’ve been eyeing.

A salesman at a dealership said that he had 50 of these vehicles just sitting on the lot. So good old “money Keith” decided it was time to haggle a great deal.

I was told there’s nothing to be purchased.

“WHAT?”

The salesman went on to tell me that those SUVs will likely sit idle in the dealer’s lot for the next five months.

What’s even crazier to me was the reason why.

They all need new semiconductors.

You may have heard about the semiconductor shortage in the news, but what does it mean for your money moving forward?

New car supply is down and prices are surging. In fact, I just read an article about how General Motors is lowering supply, pushing folks to buy vehicles sight unseen, and has even raised prices of SUVs by 20% over the last year.

That’s astronomical. This feels like more bubble-popping will be coming our way …

Trade-In Demand Surges

The ongoing semiconductor shortage has also fueled a rise in used-car prices as well.

If you own a newer vehicle and bought from a dealer, check your inbox. You’ve likely received a letter pushing you to trade in your vehicle and upgrade.

Why the buying frenzy from the dealerships?

It goes back to the massive semiconductor shortage. And when supply is down, people decide they HAVE TO HAVE what’s missing. Humans!

A lot of car manufacturers drastically reduced purchases of semiconductors at the start of the pandemic. This decision was driven by an expected drop in auto demand in 2020, and caused semiconductor manufacturers to pivot their customer focus. They started selling semiconductors to other technology companies, including manufacturers of computers, smartphones, webcams, and other gadgets.

This shift required a change in the production lines and impacted the auto industry’s supply chain. And unfortunately, you can’t turn the semiconductor supply on and off like a bathroom light switch.

Semiconductor plants pump out chips 24 hours per day, 365 days a year, but changing the production line from one that serves an automotive customer to a major tech firm (and vice versa) can take weeks or months.

One year later, the automotive industry has bounced back in the wake of the pandemic much faster than expected, and semiconductor shortages have rocked the entire automotive supply chain.

In short, the order cancelations by large automakers and their suppliers in 2020 have fueled this shortage, and now, auto companies are struggling to build new cars.

For example, Ford Motors (F) just slashed its second-quarter production forecast by 50%. The company has removed 70,000 new vehicles from its production schedules.

Ford isn’t alone. General Motors and Volkswagen have also shut down production lines over the last few months due to the semiconductor shortage. They also experienced long delays in procuring parts.

You might think that these chips are only relevant to the guidance system.

But it turns out that they impact nearly all functions of newer, more tech-enhanced automobiles. Manufacturers need the chips for lighting displays, powered head rests, roof windows, and other power features.

According to NBC, a new car typically uses 100 or more semiconductors.

The network says the semiconductor producers don’t have capacity right now to increase production.

What Can Be Done?

President Joe Biden did sign an executive order to review the nation’s supply chains. And he has called for a big uptick in spending to identify ways to eliminate the shortfall.

But this isn’t something the White House can fix overnight.

Due to production challenges, shortages of container ships, raw material shortages, and other factors, it could take up to two years before supply and demand hit its equilibrium.

As if that all weren’t enough, the ongoing crisis has affected almost every other supply chain that goes into vehicle production.

Three companies that supply vehicle seats for Ford – Lear Corp., Magna International, and BorgWarner – are likely to slash production this year, according to Reuters. Lear reduced its global production forecast from a 12% increase to a 9% increase. It also projected a 9% decline in Q2 revenues.

The results are what you’d expect.

Inventory levels will likely remain lower in the near term. IHS Markit projects that Q1 2021 production of cars and vans around the globe fell by 1.3 million units.

Consumers are likely to pay higher prices for auto parts and vehicles.

It appears we are still in the early innings of this crisis. Though it will take time to normalize, semiconductor companies will remain attractive investments for the foreseeable future.

I think what will happen over the next six months while chip makers catch up is that you’ll see more profits and leaner manufacturing in the U.S.

Then we’ll see new and used car prices plummet when there’s way too much supply.

For now, be careful in your vehicle decisions.

If you have an extra vehicle, go sell it for top dollar while you can. If you need to make a purchase, you’re probably better off waiting until the beginning of 2022.

Invest in this trend and watch it so you can get out in time. Enjoy your Wednesday.

Here is My Prediction on Corn Prices…

By: Keith Kaplan

4 years ago | EducationalNews

In about a month, I predict a new search term will enter Google’s Top 25 most-asked questions. 

It will read: “Why is the price of corn so high?”

Right now, commodity prices are surging. I’m going to spend the next few days discussing this trend. 

Today, I want to start with corn. 

Now I understand if you don’t think corn is as important as oil. 

After all, oil always generates headlines due to geopolitical tensions around the world.  

Well, corn is in just about everything we buy. And prices are surging.

Take a look at what corn futures did between March and the end of April.

The chart below offers a historical look at corn futures prices between March and the end of May for each year dating back to 1973. The chart shows that, historically, there is not a significant amount of movement for most of these years. 

However, in 2021, corn prices have surged. As you can see by the orange line near the top, December corn futures prices surged by 33% over those two months. 

This rally is an outlier compared to historical price movements. 

The last time corn prices exploded similarly was 1973, when U.S. inflation hit 6.22%. 

It is clear that we have never seen a price movement toward the upside like this since the inception of corn futures prices. And we haven’t even pushed through May yet. 

The Cure for Higher Prices

I’m sure you’ve heard the adage about high commodity prices.

The cure, as some economists say, for high prices is high prices. 

What does this mean? 

When prices are high, producers are incentivized to bring more of the commodity to the market. So, if oil prices move higher, energy producers like Chevron will pump more out of the ground. Or, in the case of high wheat and corn prices, farmers will plant more of these crops. 

As a result, supply and demand should move back into equilibrium over time. 

But 2021 is a little bit different. You see, there is a supply chain shock happening right now. 

The Wall Street Journal reported yesterday that corn prices have increased by 50% since the start of the year. The price of a corn bushel has more than doubled since last year.

Why is corn that important? Well, it’s in everything.

It’s the No. 1 largest crop in the United States for a reason. 

Corn is a key component in tortilla chips, Coca-Cola, bourbon, ethanol, makeup, and even tires. 

It’s also a critical feed input for the dairy, beef, and chicken markets.

People might think that corn’s massive run is over. But we might only be in the third inning of this commodity surge. Here’s why.

Moving Grain

Corn is a global commodity, and the United States is the world’s largest producer. 

But China and Brazil are up there as well in terms of significant production. China produces largely for itself. It also buys as much as possible from other nations. The U.S. exports a massive amount of corn to China. And China has been buying up as much as possible to satisfy its ever-increasing demand for pork and other meat products. 

In addition, the weather in Brazil has been very dry over the last two months. That has raised speculation on the price of corn. 

And there’s one more factor that I haven’t seen people discuss on a broad scale.

Since January, trucking companies have sounded the alarm about a shortage of drivers. 

This trend has been going on for the better part of a decade. However, COVID-19, combined with increased government unemployment payouts, has fractured the commercial trucking industry. 

Out west, the California League of Food Producers says there are 25% to 30% fewer drivers this year than in the past. 

Farmers are struggling to get onions and tomatoes out of the fields. Since there isn’t a robust rail network in the region, almost everything needs to be moved by truck.

This is a huge warning sign for later this year. You see, corn isn’t like oil. It’s not something that can be produced in significant abundance year-round. U.S. farmers are right in the middle of planting season. 

Harvest doesn’t start until July and goes through the end of the year. 

The big question moving forward is whether there will be enough trucks to get the corn out of the field. 

Farmers and hauling companies are already sounding the alarm about drivers across the Midwest. And unless there is a magical event that drops drivers from the sky, this could drive corn prices even higher in the months ahead. 

How to Capitalize on This Trend

Investors might think that they are behind on the corn trade. 

But we know that TradeSmith Finance can offer clear signals on what to buy and hold. 

Here is the watchlist that I’ve started to build based on the corn trend. 

CSX (CSX) is a U.S. freight rail company that will benefit from rising commodity prices. The company hauls a significant amount of grain across the United States. And with a shortage of truckers, it appears that rail operators like CSX can charge higher rates in the months ahead. The stock has been in the Green Zone since October. Over the last month, multiple Wall Street analysts have raised their price targets on the stock. Price targets range between 5.5% to 15.25% higher, according to TipRanks. I will spend some additional time looking at other rail stocks trending in the Green Zone like Canadian National Rail (CNI).

The Teucrium Corn ETF (CORN) is also in the Green Zone. This ETF tracks corn futures prices and reflects the huge gains in prices over the last year. Shares are nearly double from their 52-week low. While that might appear very expensive, it remains in an uptrend as momentum continues to push higher.

Finally, I am looking at Mosaic (MOS). As we move toward the end of planting season for corn, it’s important to note that farmers will look to plant more of the crop. Mosaic is a producer of potash and fertilizers. These are critical inputs into the planting of corn and other crops. The company had a bit of a mixed earnings report last week. However, shares are trading at an attractive P/E ratio near 13. The stock is in the Green Zone and has positive momentum due to the uptrend in recent months. 

Tomorrow, I’ll be back to talk about ways to play the ongoing semiconductor shortage around the world. If you’re in the market for a new car like I am, I think you’ll enjoy this one.