We’ve been bullish on gold since the beginning of the year. Now that the big rally we’ve been predicting has unfolded, what’s next?
Our bullish case on gold has rested on four separate signals that we follow closely. The most important signal comes directly from TradeStops. The Stock State Indicator (SSI) chart shows that gold triggered a new SSI Entry signal in April of this year and has been climbing higher since then.
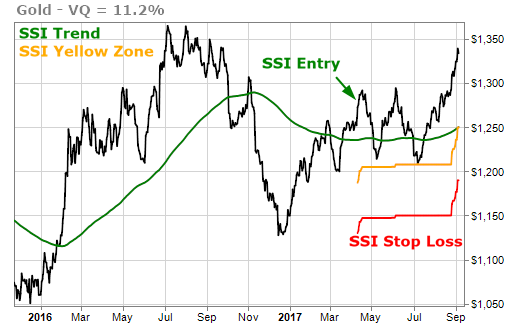
After entering the SSI Green Zone, the price of gold twice came close to the SSI Yellow Zone, but never did actually enter it. The most recent move from the low in early July has sent gold higher by more than 10% in just two months’ time.
We love to invest in what’s working… and the TradeStops SSI signals tell us that right now, gold is working.
The second signal that we follow closely is the volume-at-price (VAP) chart. It shows what prices for gold have had the most trading volume. These critical price levels are important psychological supports because of the anchoring bias that tie most investors to the price they paid for an investment.
We’ve mentioned on several occasions that a break above $1300 could send gold to the $1400 level. We’re halfway there.
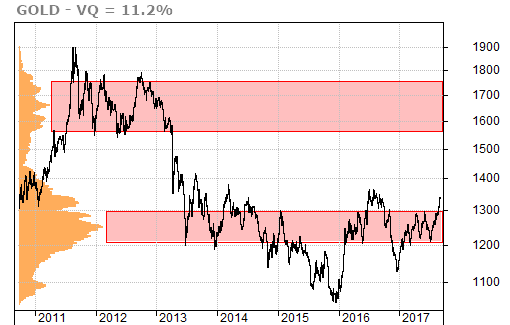
The VAP chart shows that there’s not much resistance up to the $1575 level, but we still have to cross $1400 before we can start thinking about higher levels.
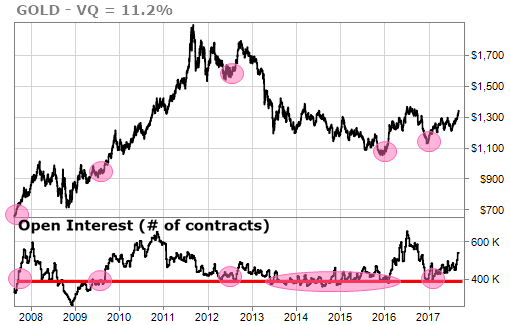
The third signal that we follow is in the futures markets for gold. As open interest increases, the price of gold is likely to rise. An increase in open interest means that there are more futures contracts opening up. Since the end of 2016, the open interest has been trending higher and bringing gold prices along with it.
The fourth signal that we follow is our proprietary time-cycle forecast for gold. This forecast has been shockingly accurate for the past two years and it currently shows gold peaking soon before taking a break and then moving higher into the beginning of 2018.
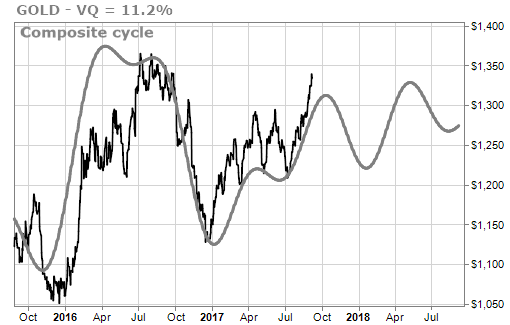
After this strong move higher of the past two months, it would not be surprising for gold to take a rest before making its next move up.
As you know we follow the signals and try to ignore the noise. The signals remain on the side of the gold bulls.
Speaking of following the signals, to our thousands of members and friends in Florida, please be careful over the weekend and into next week.
We have closed our main office and asked our employees to be sure that they’re safe. Our ability to answer your questions this week will be limited, but we will get to them.