Even with this week’s sell-off, gold is up more than 3% since we last wrote our gold price predictions in May. And it still looks to have plenty of room to run.
If you’re among our thousands of new members, you might not know that we have been bullish on gold for a while now.
We base our sentiments on the signals we’ve seen over the last few months. So, while we keep one ear on the media to know what people are talking about (and gauge my own emotions), we make my trading decisions based on evidence.
Three months ago, the media tried to get us all worked up when gold dropped nine days in a row. We told our readers then that historically, this was a good buying opportunity. And even with the drop-off this week, gold is trading 5% higher.
We continue to like gold. Let’s review the gold price predictions signals that are keeping me bullish.
Gold triggered a new Stock State Indicator (SSI) Entry signal in April and continues to trend higher. Here’s the SSI chart on gold.
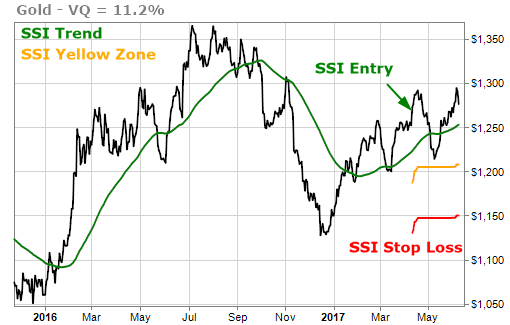
(Isn’t it amazing to note that in spite of all the noise in the media around “falling gold” over the past few months… gold hasn’t even dipped into the SSI Yellow zone?)
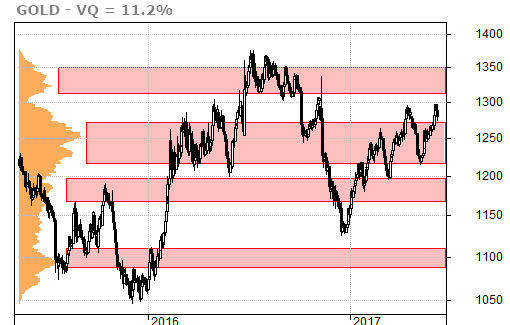
The volume-at-price (VAP) chart shows that gold recently broke through strong resistance at the $1260 level. It’s not surprising to see gold move back towards that level as that should now be a strong line of support.
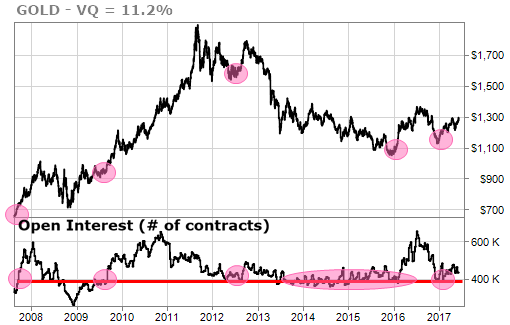
The open interest in gold futures contracts represents the total number of future contracts that are being traded. The number of contracts that are open is increasing from the lows in late 2016 and early 2017. This is historically a very bullish sign for the gold markets as it means that more market players are interested in gold.
The commercial traders of gold futures include the gold producers who use the futures markets to lock in prices that allow them to be hedge their risks. Because of this, the overall position of the commercial traders tends to be bearish. A large number of bearish contracts usually means that we’re close to a top in gold.
We’re still not seeing excessive bearishness from the commercial gold producers. That bodes well for more upside.

Finally, my proprietary composite time-cycles forecast chart has been amazingly on target through all the recent developments.
We first published this time-cycles forecast three months ago. You can see how the prices have tracked the gray cycles forecast since then in the highlighted yellow section.
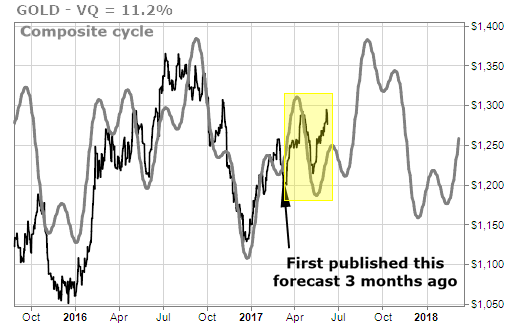
The cycles forecast predicted the move lower in gold almost exactly three months ago and the strong rebound afterwards. Kind of scary good, isn’t it? It encourages me that the summer rally we’ve been predicting is still in the cards.
Overall, these collective signals tell me that gold is still primed to make a major move to the upside. Any downward moves could be good opportunities to enter into gold or add to your position.
As always, the TradeStops way is to know your risk and make sure that you’ve got the right position size for you. The signals tell you what to consider buying, the tools tell you how much risk you should take.
TradeSmith Research Team