Investors looking for income can be enticed by high dividend stocks. But sometimes a high yield can be a sign of trouble.
Earlier this year, buyers of Stein Mart, Inc. (SMRT) could have been very happy knowing that they would be receiving a dividend yield of more than 10% per year.
But the TradeStops chart was ominous. The stock hit its Stock State Indicator (SSI) Stop signal at the end of September 2016. The stock price at that time was trading at $6.05.
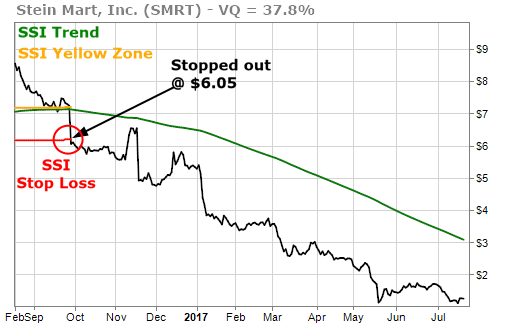
Since the SSI stop was triggered and SMRT began trading in the SSI Red Zone, the stock has fallen almost 80%. It would take SMRT 16 years of paying dividends just to break even on the stock.
And, in May of this year, SMRT announced they were suspending the dividend.
Windstream Holdings Inc. (WIN) is another example of a too-good-to-be-true income stock that has caused investors a lot of pain.
WIN was paying a dividend yield of about 10% when it hit the SSI Stop signal in November 2016. It has lost almost 40% of its stock value since then.
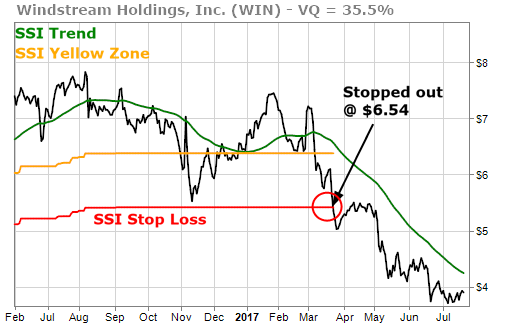
Based on the previous 12 months of dividends paid, it would take more than 4 years of dividends just to break even on this investment. And that’s if the stock doesn’t fall any further!
We’re all for high yield. But how do you know when a high yield is a warning sign to stay away and when high yield is free money laying in the corner waiting for you to just pick it up?
The TradeStops SSI, of course. We find high yield stocks trading in the SSI Green Zone are a LOT more attractive than high yield stocks trading in the SSI Red Zone.
We’ve already seen a couple of disastrous illustrations of high yield investments that entered the Red Zone. Let’s take a look at a couple of more constructive high yield investment opportunities.
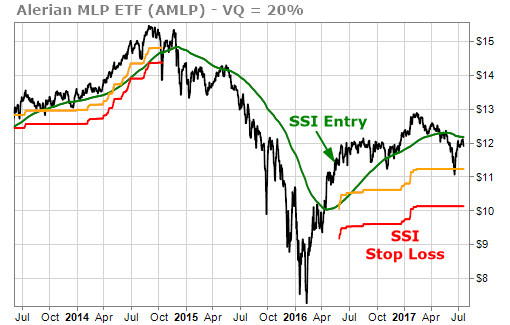
The Alerian MLP ETF (AMLP) invests in limited partnerships of energy companies. AMLP triggered an SSI Entry signal in May 2016. It has been trading flat recently as energy prices have been trading in a narrow range. The current yield is a little more than 7%.
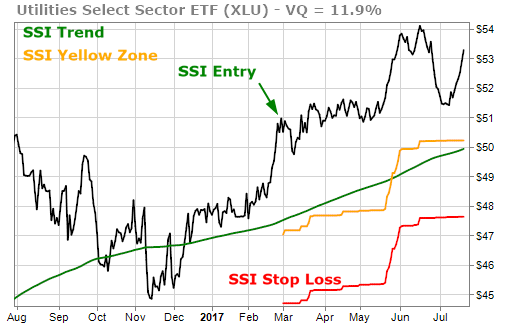
Utility stocks have historically paid high dividends. XLU is the ETF for the utility sector. It triggered a new SSI Entry signal in March and has been climbing higher. The yield of XLU is almost 70% higher than the yield of the S&P 500.
If you’re looking for income, be sure to look at the condition of the underlying stock before investing your money. The SSI signals can help you stay away from stocks with high yields that could be devastating to your portfolio.
I don’t have hard and fast numbers to give you just yet but as a general rule of thumb we’ve found that if you’re reaching for yields that are 3 to 5 times greater than the yield of the S&P 500 (the current yield on SPY is 1.92%) you really need to stick with investments that are in the SSI Green Zone so that you have that extra element of support.
High yield opportunities are often high yield for a good reason. If a high yield opportunity is also in the SSI Red Zone, it’s a big red flag.