A good friend and colleague (and Tradestops power-user) recently wrote in to let me know that he was using my new Pure Quant tool to track his rate of return. But it wasn’t delivering the results he was expecting. In fact, he was pretty disappointed. Here’s what he had to say:
I’ve been using the Quant tool for the past month. Following your instructions by selecting the newest stocks to move into green mode. The results haven’t been good:
- CTWS – up 3.53%
- USB – down 2.6% (stopped out but then got back in)
- SYMC – stopped out for a small loss
- ATEN – down 24% (down 19% today)
Anyway, luckily, I used the position sizing tool to keep these losses overall pretty small (although the ATEN hurts).
There’s an important lesson in his observations. Let’s start by taking a look at his most painful example above – ATEN.
ATEN is the symbol for A10 Networks, Inc. a network technology company out of San Jose, California.
If we look at a chart of ATEN showing the Tradestops Stock State Indicator (SSI) lines, we can see that ATEN has been moving back and forth between the Yellow Zone and the Green Zone all year long.
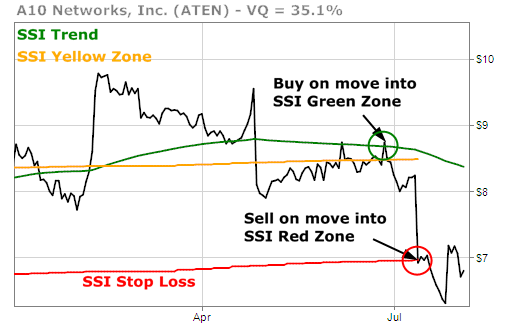
I don’t know exactly when my colleague bought ATEN but let’s assume that it was on the most recent move of ATEN from the Yellow Zone to the Green Zone. That would have been on June 28 when ATEN closed above the Yellow Zone at $8.74.
ATEN drifted back down in the Yellow Zone almost immediately until a couple of weeks later it missed on earnings and fell 16% in a day. That 16% drop was enough to send ATEN into the SSI Red Zone. Ouch.
ATEN is a volatile stock. The current Volatility Quotient (VQ) on ATEN is 35%. The definition of the Yellow Zone is that you’re a little more than halfway to the stop loss already. So the additional 16% drop was enough to take out the stop.
I was happy, by the way, that my friend mentioned that he had kept his losses small overall by using the position sizing tool. That’s exactly how it should be done.
Still, a loss is a loss. They’re never easy. The question is, does an abrupt and sharp hit on a stock like ATEN prove that there is a fundamental flaw in my new Pure Quant portfolio builder? After all, it was highly ranked by my new tool.
I don’t think so… and it’s important to me that you understand why.
My new Pure Quant portfolio builder was designed to help build a portfolio of stocks. It wasn’t designed to pick individual stocks. Most of the portfolios that we’ve highlighted with the Pure Quant portfolio builder have consisted of about 20 stocks which were all selected together from near the top ranks of the Pure Quant portfolio builder ranking algorithm.
Here, for example, is our Billionaire Pure Quant portfolio that we’ve been talking about a lot the past couple of months.
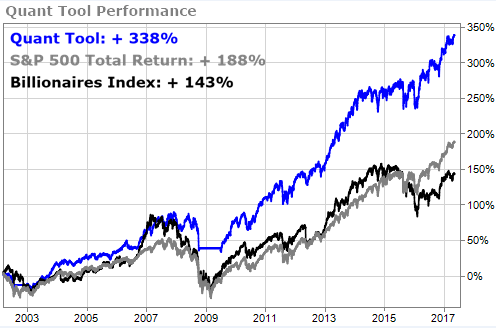
Moreover, the minimum number of stocks held in this portfolio was 10. If there weren’t 10 stocks in the Green Zone to choose from then we exited all positions and went to cash.
Any one individual stock could be ranked highly by the Pure Quant portfolio builder and still go bust. Picking individual stocks isn’t what the tool was designed to do. It was designed to help you select a portfolio of stocks that had better than average potential for success while still offering sufficient diversification to protect against one or two dud investments.
Just to further prove my point I asked my team to run a study that limited the Pure Quant portfolio builder to a maximum of just 5 stocks instead of a maximum of 20 stocks. You can see how that turned out by looking at the red line in the chart below.
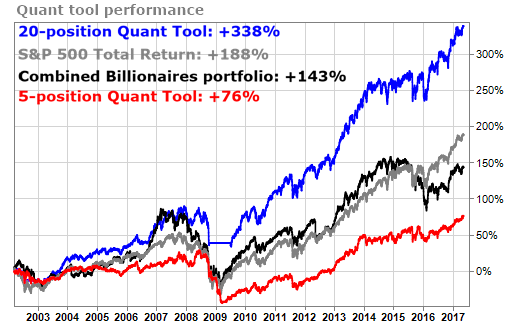
I’m a big advocate of individual investors having more concentrated portfolios than most other investors … but limiting a portfolio to just 5 stocks max is WAY too much concentration.
What’s the optimal amount of portfolio concentration for individual investors?
I’ve got my team working on that very question as we speak. I look forward to sharing our results with you in this column next Tuesday.