Last week we looked at the case for the end of the 9–year bull market. We pointed out several reasons why investors should be concerned that the end of the bull may well be at hand.
- The Dow Transports have not confirmed the recent highs of the Dow Industrials.
- The VIX is trading at the same lows where it traded before the 2007–2009 crash.
- The recent rally is being led by just a handful of larger tech companies in the S&P 500 rather than by the broader market.
But we also hinted that just because there are some ominous signs, it doesn’t necessarily mean the end is nigh. There are just as many, if not more reasons for the markets to continue moving higher after a much–needed and well–deserved breather.
One of the biggest drivers of the 2017 stock market rally has been the declining US dollar. We’ve been writing about the expected decline in the dollar since back in January. We’ve been right… and, judging by the volume–at–price chart of the USD below, the bottom for the USD may still be a ways away.
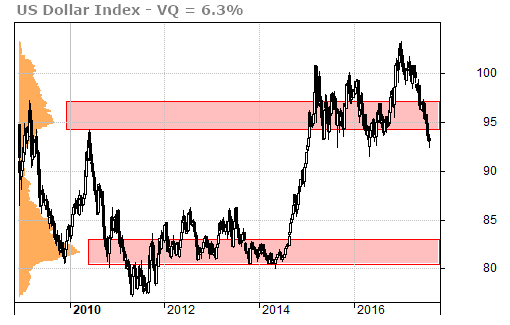
Yes, the US dollar has found support at current levels in both 2015 and 2016 but it’s looking over a precipice at the moment. This time, I fear financial gravity will provide the final push.
Why do I fear that the third time is the charm for the US dollar falling through its $93 floor? Because of this time–cycle forecast:
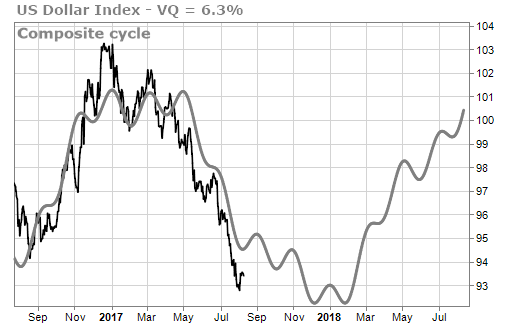
We will likely see a rally in the US dollar through mid to late August. That will correspond nicely with the current stock market correction. After that, USD is very likely headed lower… and the stock market higher.
The time–cycles in the stock market also suggest we’re currently seeing more of a short–term correction than a long-term trend change. I’m expecting a near–term correction… and it could even be dramatic… but I expect that the S&P 500 will be heading steadily higher again by early September.
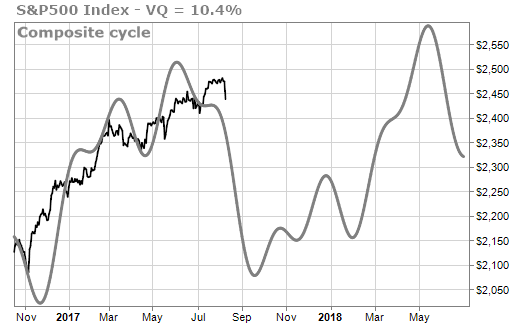
(Note – I don’t pay much attention to time–cycle amplitudes… just direction. The fact that the gray time–cycle line above goes down to 2,100 is not a price forecast.)
Of course, the strongest indicator of higher stock market prices ahead is the very recent higher prices just behind us. It’s a bull market don’t you know.
Here’s the latest TradeStops SSI chart on the S&P 500…
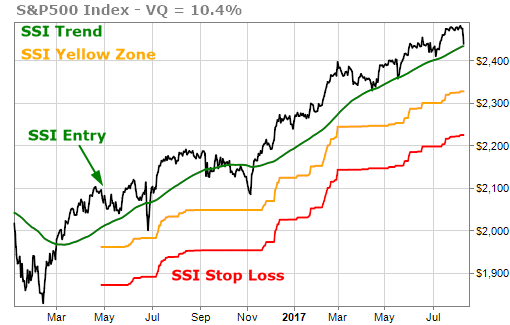
I won’t even blink until I see the S&P 500 crossing into the Yellow Zone below 2,325. If it does breach the Yellow Zone, we’ll still have another 100 points to go before stopping out at 2,225.
As I’ve said before, learning to hold on to my winners and ignore the noise is one of the single biggest positive changes I ever made as an investor. I encourage you to do the same.