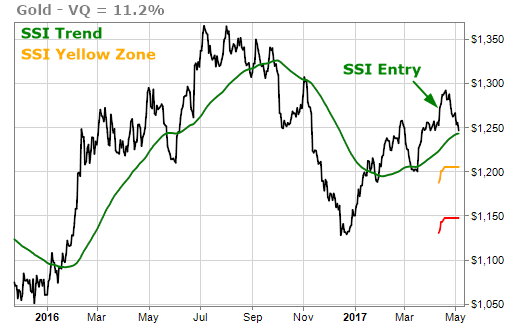
Gold triggered a new Stock State Indicator (SSI) Entry signal on April 11, 2017. It’s down 3.44% since then … exactly where we thought it would be. So now you’re wondering, should you buy gold stocks?
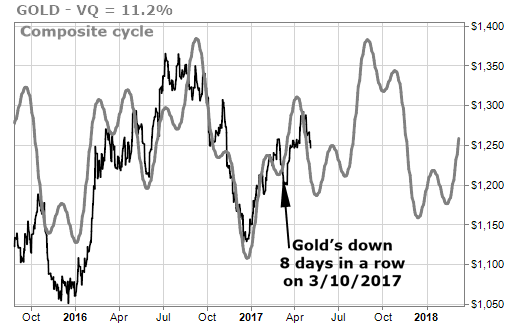
Two months ago, gold had just finished moving lower for eight days in a row. We pointed out that this had only happened seven times since 1973 and it was actually a very bullish sign. Five of the seven times this happened previously, gold rebounded over the next three months with an average move higher of more than 4%.
On that same day, gold was moving lower yet again and we also told you that a nine-day loss was even more rare as that had occurred only four times in the past 40-plus years. And the gains afterward were spectacular, with gold moving an average of 30% higher at the end of eight months.
So let’s revisit where we are.
Gold closed yesterday, May 4, 2017, under $1,230. The drop in price from the most recent high of $1,292 is a little less than 5%. We’re not even close to hitting the SSI Yellow Zone price of $1,205 yet, and we’re a long way from stopping out.
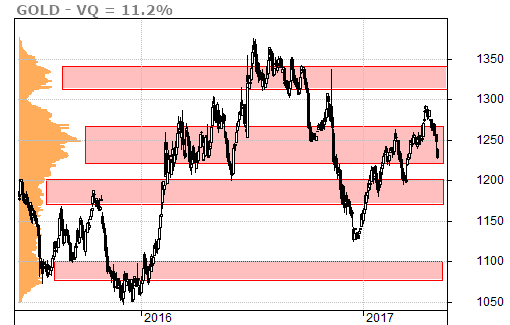
The volume-at-price chart shows that gold is trading in the middle of strong support which should hold up around the $1,210 level.
The open interest in gold futures contracts represents the total number of future contracts that are being traded. The number of contracts that are open is increasing from the lows in late 2016 and early 2017. This is historically a very bullish sign for the gold markets.
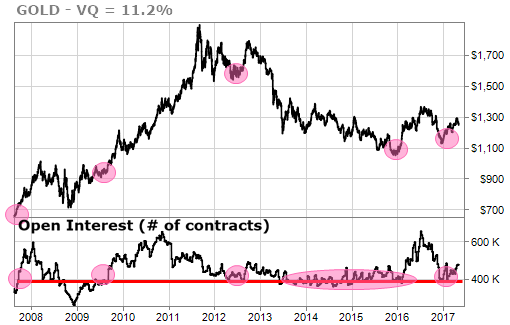
The commercial traders of gold futures include the gold producers who use the futures markets to lock in prices that allow them to be profitable. Because of this, the overall position of the commercial traders tends to be bearish. A large number of bearish contracts usually means that we’re close to a top in gold.
At the current time, the bearish interest is just beginning to increase from low levels. This is a bullish condition, especially combined with the increasing amount of open interest in the gold contracts.

The composite time-cycle forecast chart has been eerily on-target. It predicted the move lower in gold almost exactly two months ago and the strong rebound afterwards. This recent move lower was also predicted and it looks as if this downward move should end sometime this month.
The path of least resistance for gold remains to the upside. The recent two week decline still leaves the price of gold higher than it was when we highlighted the opportunity to go long in March and I remain bullish.
If gold continues to move lower over the next few days, the media outcry will try to scare you out of your positions. You can just ignore them.
The TradeStops way is to know your risk, take a stand and tune out the noise.
No sweat!
TradeSmith Team