Three weeks ago, among the gloom and doom headlines, something happened that triggered the bullish case for gold.
Back then, gold was on an epic losing streak, down 8 days in a row and heading for a 9th straight decline. The headlines were decidedly negative.
-
- Will gold continue to drop?
- Gold forecast to continue lower versus US dollar
- Commodities are weaker amid the firmer dollar
While everyone else panicked, we chose to look at the historical data.
What we found…and what we told you about in these very pages…was that contrary to being a bearish signal, gold down 8 days in a row was a strong bullish signal.
That turned out to be the right call, with gold now up 4% in just 3 weeks. And it looks like this is just the beginning.
We’ve been publishing a cautious bullish case for gold in this column all the way back to November of last year when I told you about the signal we’re waiting for. The bullish case for gold has continued to shape up nicely since then. Let’s take a look.
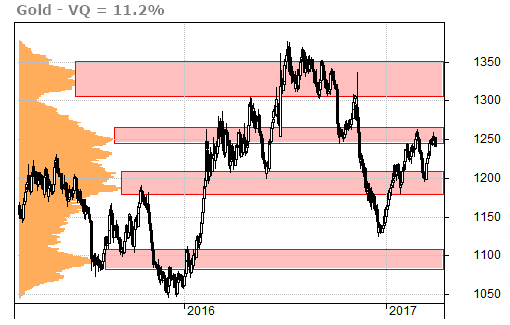
The volume-at-price chart clearly shows that 3 weeks ago gold bounced off the top of support in the $1200 range. If it can hold this level, then there’s not much stopping gold from heading into overhead support at $1,300.
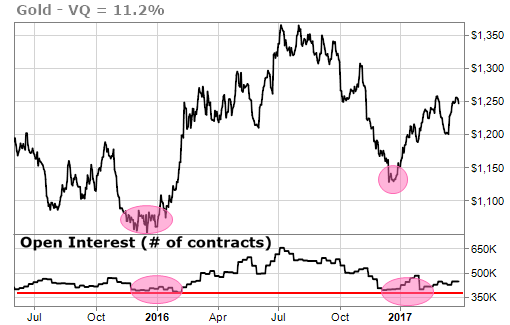
The open interest of gold futures contracts is rebounding off one-year lows. That’s a noteworthy signal, because when open interest climbs, it means more players are getting into the market…As that happens, the price of gold should tend to move higher.
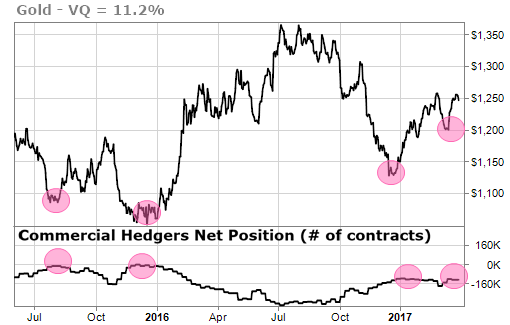
Moreover, the commercial traders of gold contracts are at their least bearish position in the past year. The producers of gold use the futures markets to lock in prices that are acceptable to them to ensure their profitability. When the commercial interests aren’t hedging their gold production, it means they expect gold to move higher…which it usually does.
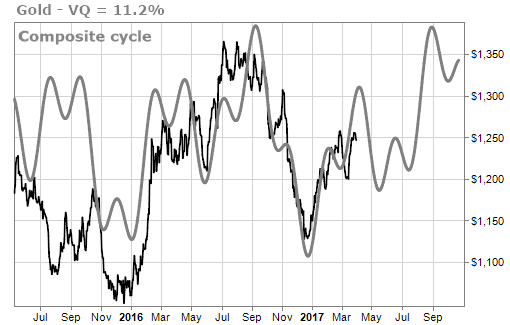
Finally, my proprietary time-cycle forecast shows the possibility of a small correction before summer followed by a long move higher into the fall.
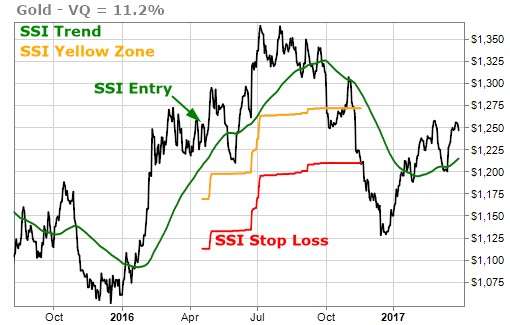
Part of the reason we’ve been “cautiously optimistic” on gold is that gold is still in the SSI Red Zone since stopping out late last year. That’s very close to changing now.
Gold is currently up just over 11% since it’s December 2016 low. That’s important because the VQ on gold is currently 11.2% and one of the criteria for the SSI changing from red to green is for gold to have gained more than 1 VQ from a recent bottom.
We also need the SSI trend to turn decisively positive. The SSI chart on gold below shows that’s in the works as well.
All in all, there’s a lot to be excited about for gold right now. Our “caution” is on the wane. If April brings us a constructive correction, a green light from the SSI and increasing open interest, we’ll be throwing caution to the wind.
TradeSmith Team