Big news from the Federal Reserve this week. They’re going to start selling the bond holdings that they have accumulated since beginning their quantitative easing program more than 8 years ago. If you’re in the market for buying bonds, you need to know how this news will effect your bottom line.
Is this the beginning of the end of the 30-year bear market in long-term yields? What are the implications for income investors?
Let’s take a look.
Here’s an update to the long-term trend chart in yields on 10-year Treasury Notes.
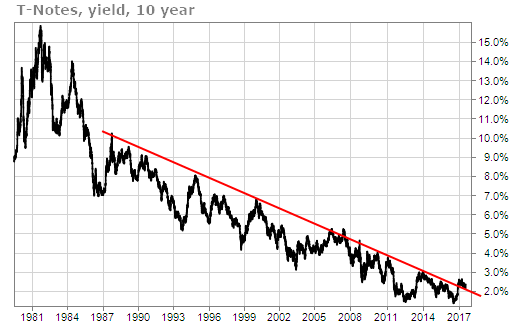
We last looked at this chart back in October of 2016… when the 30-year downtrend in T-Note yields was still intact. Today, yields are above that long-term downtrend line. If that trend break holds, it’s a very big deal.
On a shorter time-frame, we can also see that yields on T-Notes triggered a Stock State Indicator (SSI) Entry signal in December of 2016.
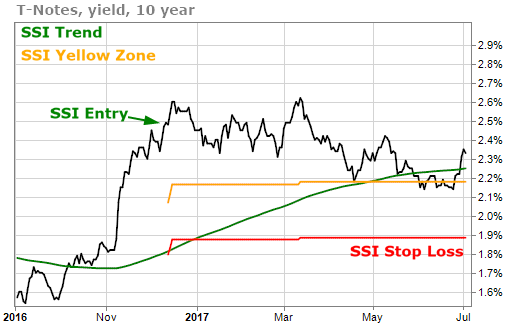
T-Note yields, of course, move inversely to the price of the T-Notes themselves. As yields rise, the price of T-Notes go down. That’s bad news for income investors that are already heavily invested in long-term income instruments like T-Notes.
The Fed currently holds around $4.5 trillion of long-term US Treasuries and mortgage-backed securities. They announced a plan to begin selling these systematically with the sales most likely beginning this September. Within a year, the sales will be $50 billion a month.
That is very likely to put downward pressure on bond prices, which will continue to push yields up. The futures markets certainly believe that to be the case.
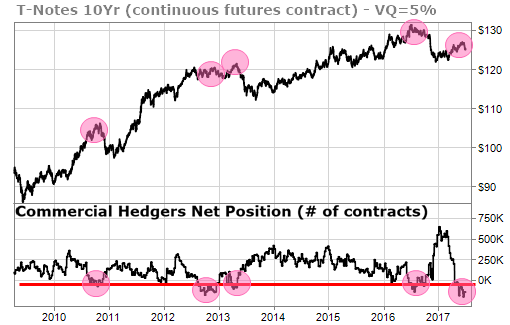
The commercial traders in the futures markets are holding very large short positions. This is a bearish sign for the prices of the 10-year notes and could be a catalyst for interest rates to rise even further.
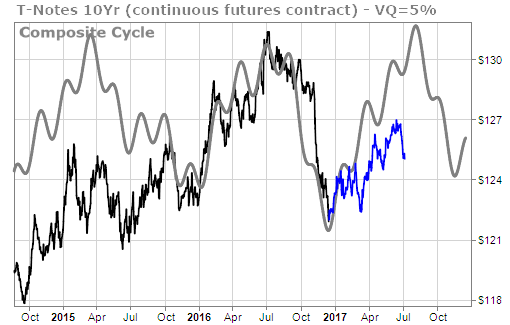
The time-cycle forecast for the 10-year Treasury has moved almost exactly as it was forecast last year (the blue line is the price movement of T-Notes since late December). Back then we were forecasting that prices would likely move lower by July or August. Looks like we were a couple of weeks early.
So, what’s an income investor to do in an environment of rising rates and lower prices? We still like a couple of themes that we suggested back in March.
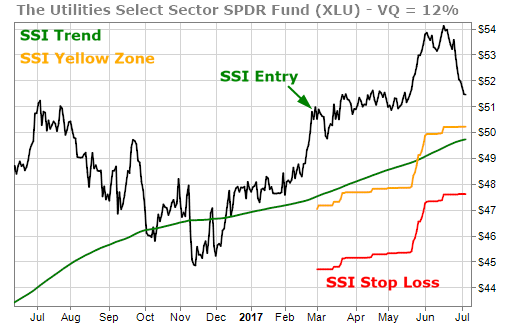
XLU is the Utilities Select Sector SPDR ETF. It has moved about 2% higher since the middle of March and the yield has increased about 10% since that time as well. It is now yielding 3.3%.
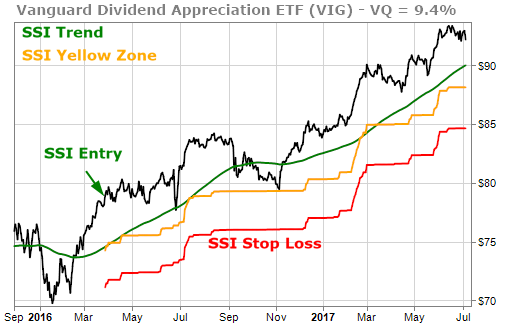
Stocks that have a history of increasing their dividends could do well in an environment of rising rates. The Vanguard Dividend Appreciation ETF, VIG, is also higher by a little more than 2% since we mentioned it in March. It has a dividend yield of 1.9%.
Interest rates won’t zoom higher overnight, but they are moving higher. Interest-sensitive funds could move lower in price and become more volatile. The Fed’s actions could cause pain for income investors who are not preparing for higher rates. Now is the time to be thinking about what higher long-term interest rates might mean for your portfolio.