Biotech is not for the faint of heart. For a risk-savvy investor, however, huge gains are possible. Today I would even say that they are not only possible … but probable.
We’ve written about the “sell in May and go away” phrase. It does have some merit, but it doesn’t perform nearly as well as investing using the TradeStops Stock State Indicator (SSI) signals.
We prefer finding investments that have an opportunity to perform well in May and beyond. Something with a good track record and that is well-positioned to continue moving higher.
And if the trade has a 10-year track record of 100% winners, even better!
That’s exactly what we’ve got going today with the biotech industry.
XBI is the S&P Biotech ETF. It began trading in 2006 and is currently composed of 92 biotech companies. It’s a good proxy for the biotech industry.
For the past 10 years, from February until September, trading in XBI has been profitable. Even during the 2008 market crash. And it’s currently set up for more moves to the upside.
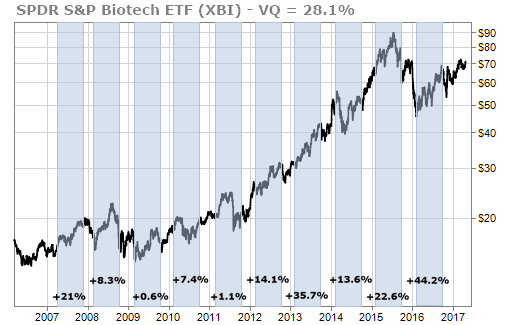
Here’s the historical chart of XBI that shows all the long trades with the profits for each time the trade was active.
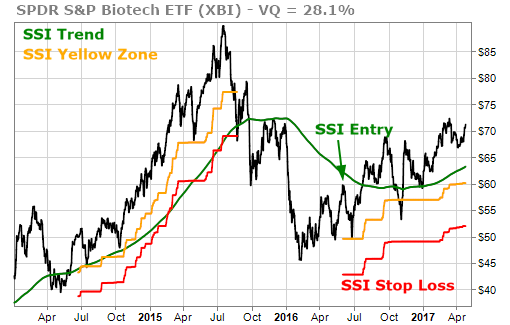
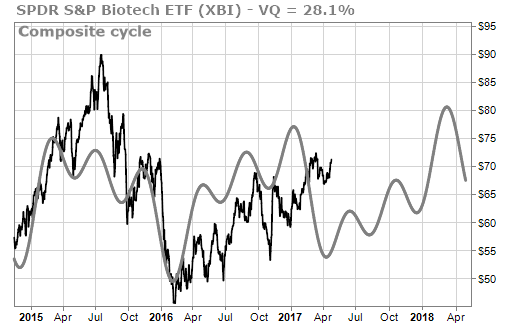
After dropping sharply during the second half of 2015, XBI turned around in early 2016 (at the exact same time that this seasonal pattern in biotech predicted it would) and then triggered an SSI Entry signal in early June. It’s had a strong move higher since then.
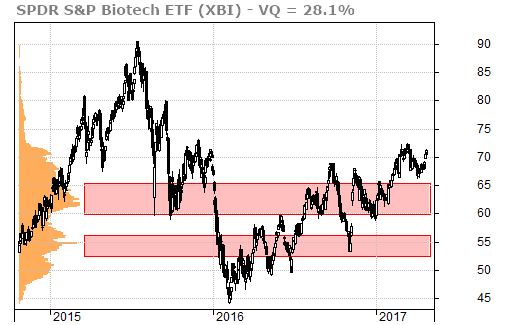
The volume-at-price chart shows the recent strong move propelled the stock above its previous resistance level in the upper $60s. It’s now forming a new support level around $70.
Here’s yet another interesting piece of information…
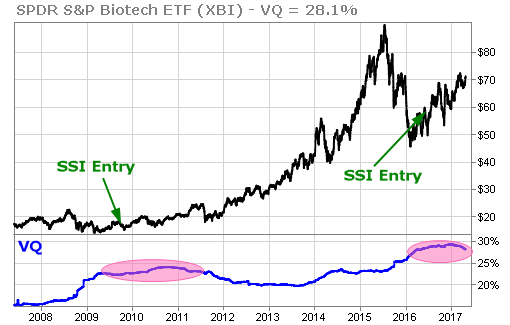
During the downturn in 2015 and shortly thereafter, the Volatility Quotient (VQ) moved up to almost 30%. This higher-than-average VQ can act as pent-up energy to continue the upward move for a long time to come.
My time-cycle forecasts also support this move higher in XBI. The composite forecast shows that the move higher could extend into early 2018.
Here’s a chart that shows all the trades that could have been made in XBI over the past ten years.
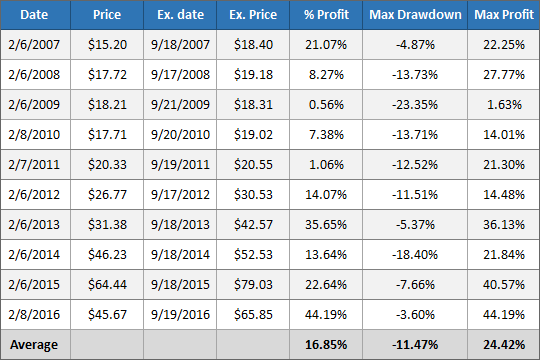
The average gain between February and mid-September in XBI is nearly 17%! As of today, XBI is up about 7% from early February 2017.
It looks like there could well be another 10% sitting on the table for biotech in the next 5 months. Just don’t forget that biotech is risky. The VQ on XBI is 28.1% … and that’s across 92 different biotech companies!
The industrious among you may want to drill down even further by looking for the best individual biotech companies in the industry which could benefit from this tailwind.
That’s what I’m going to be doing.
Always looking for opportunities … and ignoring the media,
TradeSmith Team