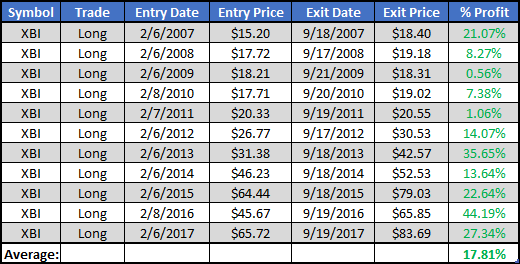
This past April we told you about a simple trade in biotech that made good money every year for the past 10 years. The trade is now over, and it was another winning year. Is it time to sell biotech now?
The trade that we identified is the S&P Biotech ETF, XBI. XBI holds more than 100 biotech stocks. This ETF is composed so that the 100 stocks have a similar weighting.
The giant biotech companies – like Amgen (AMGN), Biogen (BGEN), Celgene (CELG), and Gilead (GILD) – don’t overpower the smaller companies in the ETF. This means that price gains of the smaller specialty biotech companies have a better opportunity to positively impact the ETF.
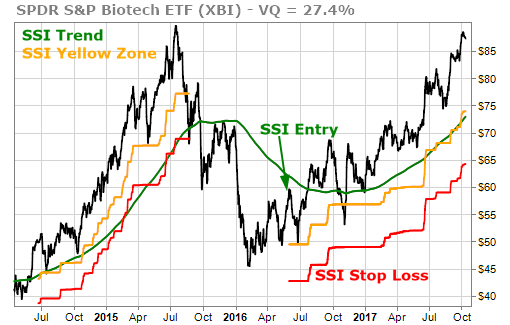
XBI most recently triggered a Stock State Indicator (SSI) Entry signal in June 2016 when the stock was trading under $60. The stock is up almost 50% since then, and hit a new high of $88.51 last week. The Volatility Quotient (VQ) is 27.4% which puts it in the upper level of medium risk.
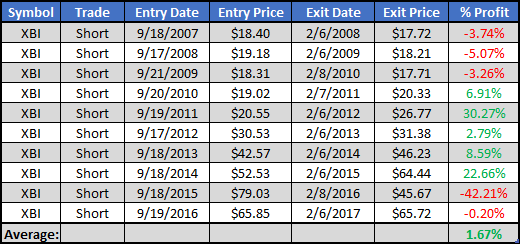
In the ten annual periods from September-to-February, XBI hasn’t performed nearly as well. The average gain during this 10-year period of time is only 1.67%. Half the time, XBI has made money, and half the time it has lost money. One year, 2015, it lost a lot of money.
The time-cycle forecast is showing that XBI could drop into the end of November before turning higher into the first quarter of 2018.
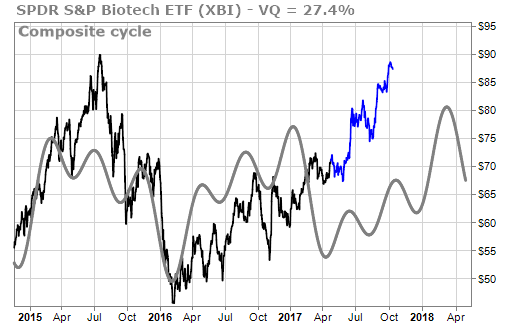
We could definitely see XBI take a breather here. The cycles and the seasonals, both support the idea of a pullback, as does the fact that XBI is up 25% in the past 6 months.
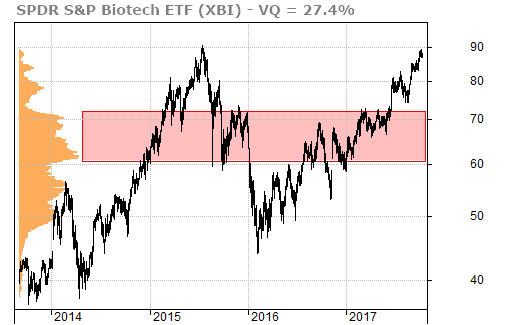
Given the strong bullishness of XBI overall, however, a pullback into the low $70 range looks like a very attractive buying opportunity to me … especially if it dips near $70, and rises back above $75 again.
Finally, I’m speaking twice today at Harry Dent’s Irrational Economic Conference in Nashville. It’s always a pleasure meeting with current TradeStops members, and welcoming new members into the TradeStops family.
I love the theme of “irrationality” but probably for a different reason than most others. I believe that the irrationality of the markets is what creates our opportunities as investors.
It’s like Kipling said in “If”…
“If you can keep your head when all about you
Are losing theirs…”