“Sell in May and go away” ” is a phrase you hear a lot this time of year.
There are a lot of good reasons to sell in May, but we’ve got something better. But first let’s look at where the whole “sell in May” idea comes from.
Since 1929, the average return of the Dow Jones Industrial Average (DJIA) from May through October is 1.1%. The average return from November through April, on the other hand, is literally 5 times as big…5.6%.
What we’re looking at here is a week by week average gain over the past 67 years in the DJIA. Don’t worry too much about the left-hand scale of the chart here. Just note the direction.
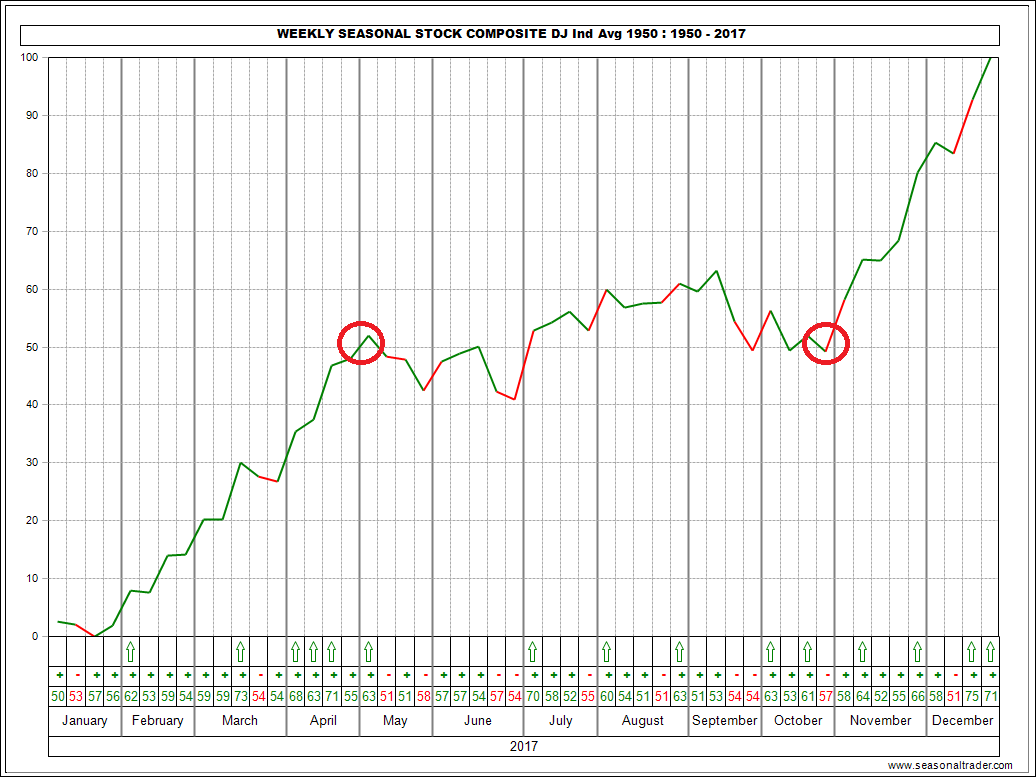
From January to early May, the trend is up. Then from May through October (between the two red circles) the DJIA basically goes nowhere. Finally, the upward trend resumes through the end of the year.
So you can see that there are good statistical reasons why the “sell in May” story has legs. Why bother taking the risk of being in the markets for half the year if you aren’t likely to get any benefits?
Well, it isn’t entirely true that you don’t get any benefits. In fact, here’s a chart that shows if you bought and held from 1929 to today vs. only being in the market from November through April, you did slightly better with buy and hold.
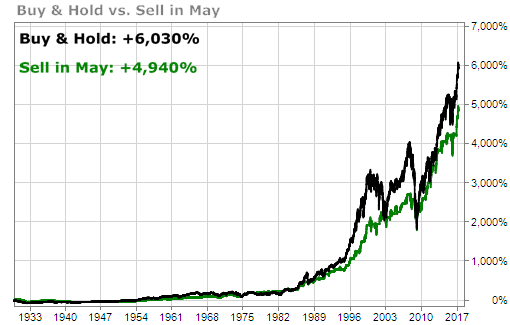
But was the extra reward worth the extra risk? That’s always the key question.
The ride up on the green line was smoother than the ride up on the black line. You didn’t have to suffer through those huge corrections along the way.
That’s why some people like to sell in May and go away. You can take a little less reward in exchange for a lot less risk.
But what if you could have your cake and eat it too? What if you could take less risk and get more reward? Would that be interesting?
You bet…and you can do exactly that with the TradeStops Stock State Indicator (SSI) system.
The TradeStops SSI system is our green / yellow / red light system that helps investors decide when to buy and when to sell. How did it do vs. buy and hold and the “sell in May” strategy? Take a look.
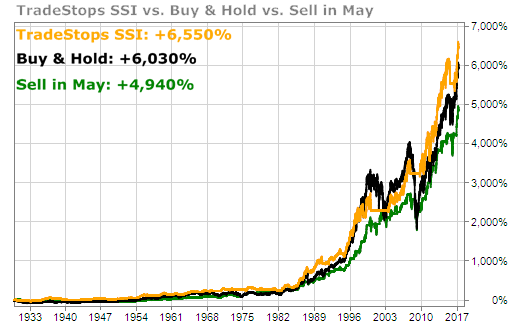
Not only did the TradeStops SSI system crush the sell in May strategy, it even beat buy and hold and did so with less risk.
The way that you really evaluate reward vs. risk is by looking at Risk Adjusted Returns. How many units of reward did you receive for each unit of risk taken? That’s where the TradeStops SSI system shines!
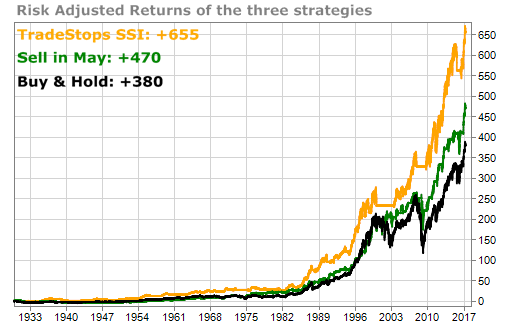
You can see in the chart above how the “Sell in May” strategy outperformed Buy & Hold in terms of reward vs. risk. It produced more reward for the risks taken.
The TradeStops SSI system, however, produced more reward AND took less risk.
It’s yet another piece of evidence that you can save yourself a lot of trouble by ignoring the mainstream financial press and listening to TradeStops.
Oh yeah…and you can make a lot more money too!
TradeSmith Team