It’s Halloween… and we’ve found a powerful way for you avoid the scariest stocks in the market.
Last week, we showed you how TradeStops could have helped you avoid the 1987 Black Monday market meltdown. This got us thinking how TradeStops could help an investor avoid the sharp moves lower that can occur with individual stocks.
To investigate this question, we turned out our database of “billionaire” trades. We analyzed 1,891 different trades executed by our favorite group of a dozen well-known billionaire investors. The trades all took place over the 30-year period between 1987 and 2017.
What we found probably won’t shock you (if you know us a bit already) but it certainly provides further evidence that our TradeStops strategies are on the right track.
We broke the trades into two groups – those that started their down move in the SSI Red Zone and those that started in the SSI Green or Yellow Zones. A sharp down move was defined to be a move down in one day that was larger than the stock’s Volatility Quotient (VQ).
Before we get to the results, let’s look at a specific example just to make sure that the concept is clear.
Billionaire investor David Tepper owned Teva Pharmaceuticals (TEVA) as of early 2017. Teva has been in the SSI Red Zone for quite a while now already. It turned red back in September of 2015.
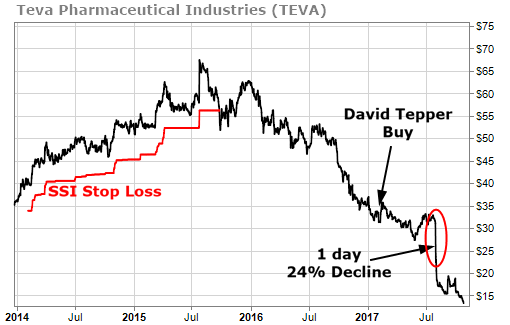
On August 2, 2017 Teva closed at $31.09 and the VQ on Teva was 21.8%. One day later, on August 3, 2017, Teva closed at $23.63 – a fall of 24%. Since this 24% fall in one day was greater than the VQ of 21.8% it met our criteria of a one-day sharp move down.
Since Teva was in the SSI Red Zone at the beginning of the down move, this particular sharp down move went into the Red Zone bucket.
Ok, now that you’re hopefully clear on the concept, let’s look at the results:
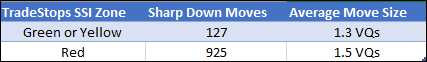
Wow. I don’t know about you but I find these results shocking. Now I’m really scared of holding stocks in the Red Zone!
Why are stocks so much more likely to drop suddenly when they’re already in the SSI Red Zone? It’s important to understand what it means for a stock to be in the SSI Red Zone.
A stock that is in the SSI Red Zone has previously triggered an SSI stop signal. That means the stock has exceeded its normal volatility to the downside. The stock is trying to tell us something.
It’s telling us that there is something wrong with the stock. It is not behaving normally. It doesn’t mean it’s going to crash, but it is signaling a red flag.
The red flag was ignored by David Tepper when he bought into Teva and Tepper paid the price. Teva entered the SSI Red Zone on September 25, 2015 at $55.83. It was already down 44% from there when it closed at $31.09 on August 2, 2017 – right before its big move down.
Today Teva sits at $13.32… down 76% from where it entered the SSI Red Zone.
We all want to get a “deal” by buying stocks that have fallen in price. But buying stocks that are in the SSI Red Zone might give you a deal that you hadn’t bargained for.
As I wrote over a year ago, Going Green is the smartest strategy to follow if you want to have long-term success in the stock market.