It’s often said that bull markets climb a wall of worry. That’s certainly been true of this eight-year long bull market. Investors have been nervous and incredulous about this bull market ever since the bottom in early 2009.
What we’re seeing today, however, suggests that all the worry that’s fueled this bull market may have finally been used up.
The CBOE Volatility Index (VIX) measures the short-term volatility of S&P 500 options. In the media, it’s called the fear index. Usually, as the S&P 500 is moving higher, the VIX is moving lower. Institutional traders trade VIX futures all the time and use the VIX as a way to hedge against possible downward moves in the stock market.
Going back over 20 years, the VIX has traded with a strong area of support between 13–17 as can be seen in the volume-at-price (VAP) chart below.
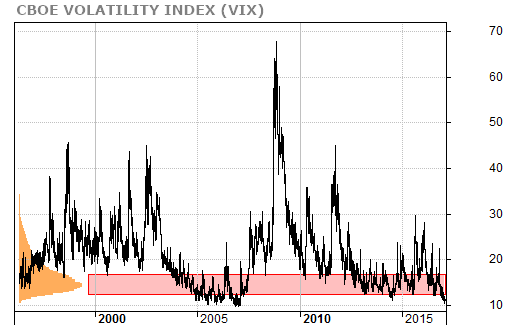
The VIX has been creeping closer and closer to the 10 level. It recently moved under 11 during the last week of January.
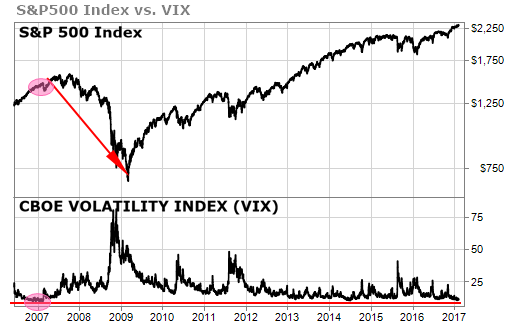
Why is this level important? Because the last time the VIX traded at this level was in 2007 before the market crash of 2007-2009.
You can see the critical 10 level in the bottom area of the chart below. You can also see what happened to the S&P 500 the last time we saw the VIX dip below 10 in early 2007.
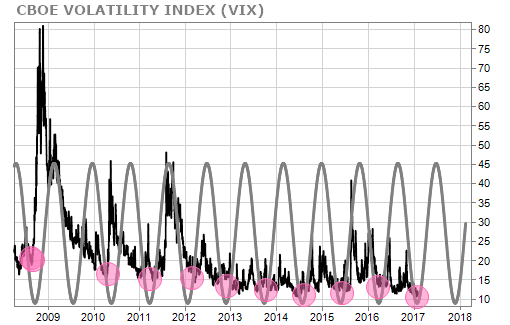
Each time that this cycle bottomed, the VIX moved higher going forward. And that usually means the S&P 500 is going to move lower.
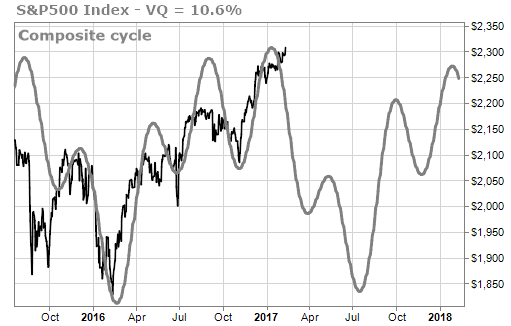
The time-cycle forecast for the S&P 500 also shows that the market is close to hitting its top and could well move lower over the next few months.
We’ve shared my concerns about the current state of the U.S. stock market several times recently. We’re still favoring a move lower in U.S. stocks in the first half of 2017. The fact that the VIX may very well be forming a significant bottom here close to 10 only adds to those concerns.
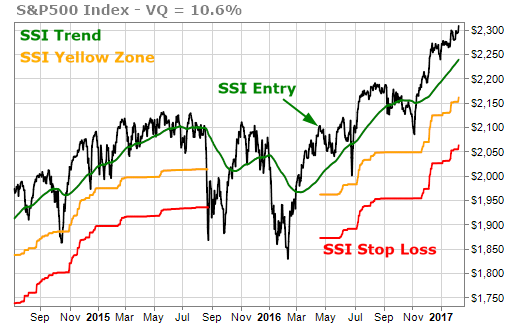
Of course, the TradeStops Stock State Indicator (SSI) is still solidly green for the S&P 500.
Letting our winners run is part of our core philosophy. We’re not hitting the panic button on U.S. stocks by any means, but we do believe that it’s a time for caution and definitely not a time for irrational exuberance.
TradeSmith Team