We are well into the ninth year of a bull market that has barely seen any 10% corrections, much less a 20% drop. But warning signs that this bullish market are coming to an end have begun to show up.
We’ve seen a couple of “shudders” in the markets the past two weeks and many investors are spooked. I believe the warning signs that have popped up over the past couple of weeks deserve attention.
I’m not spooked, yet. But I am taking notice.
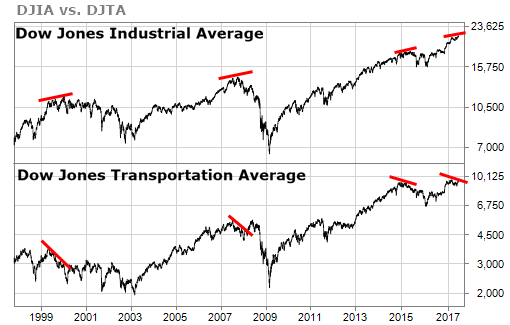
The most visible warning sign comes courtesy of the famed Dow Theory.
The Dow Theory states that the Dow Jones Transportation Average (DJTA) must also be trading at new highs for the new highs of the Dow Jones Industrial Average (DJIA) to be confirmed, otherwise the trend of the DJIA is not sustainable.
And that’s where we are today: The short-term trend of the DJTA is to the downside, yet the short-term trend of the DJIA is to the upside.
Since 1999, each time this has occurred has been the precursor of a downward move in the DJIA.
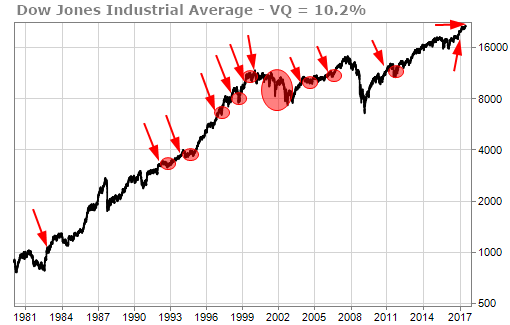
Another warning sign is the divergence in the DJIA and the Nasdaq Composite Index (COMP). The DJIA is trading at new highs, yet the COMP is trading more than 2% off its most recent highs.
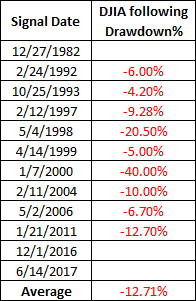
Since 1971, there have been 12 times that the DJIA has been at new highs with the COMP at least 2% off its highs. In 9 of the previous 11 occurrences, the DJIA has moved lower.
Here are the exact numbers on those drops in case you’re interested:
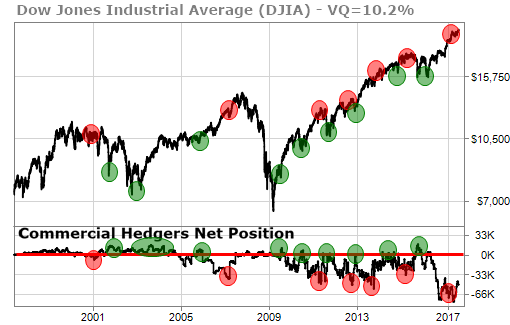
When it comes to sentiment, I like to follow what the smart money is thinking. For that, I look to see what the commercial traders are doing in the futures markets. Right now, the commercial traders in the DJIA have a historically-large net negative position. When their positions have been negative in the past, it has led to downturns in the DJIA.
If the DJIA (and likely the broader stock market as well) is going to correct, where could this correction finally end up? The volume-at-price chart gives us a good view.
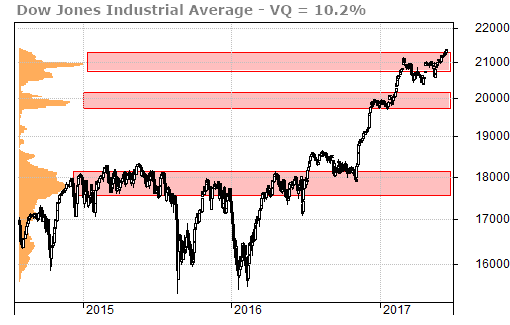
The first move lower could take us down to the 21,000 level. That’s a drop of almost 5% from its current levels.
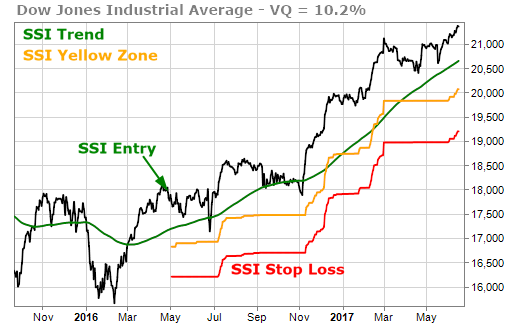
If it drops through the 21,000 level, the next stop could be below 20,000 and that’s very close to the Stock State Indicator (SSI) Stop which is currently at 19,200.
Knowing that there is evidence of a potential move lower in the market, does this cause me to change my investment strategy? A little bit… but not much.
I wrote at the end of 2016 that I’m not going to overreach and take on too much risk at such times, but I’ve also learned that staying in my winners as long as I possibly can is the single best strategy I know of.
The correction that I feared at the end of 2016 didn’t happen. I stopped adding new positions at that time but I didn’t sell my winners. That’s where I’m at again today.
There will always be uncertainty in the markets. That’s why financial markets exist – to spread the risks that result from these uncertainties.
Turbulent waters may be ahead, but that doesn’t mean that we need to alter course. It does mean that it may be time to trim sails and batten down hatches.