Featured

A Travel Crisis Grows as We Approach a Hectic Holiday Season

By: Keith Kaplan

4 years ago | News

Many Americans are looking forward to traveling for the holidays to see family and friends, after lockdowns and COVID-19 waves hindered their plans last year. But the airline industry is facing a new problem. The current labor shortage could create another set of challenges for an industry in need of recovery.

Many Americans are looking forward to traveling for the holidays to see family and friends, after lockdowns and COVID-19 waves hindered their plans last year. But the airline industry is facing a new problem. The current labor shortage could create another set of challenges for an industry in need of recovery.

Read Full Article Array
Featured

The Last-Mile Trend is The First Way to Profit After COVID-19

By: Keith Kaplan

4 years ago | News

I spoke about a few of the changes COVID-19 is bringing, such as the shift to working and living remotely and the economic consequences. Today, let’s look deeper at another one of these trends: the future of delivery.

Read Full Article Array
Featured

The 21st-Century Pearl Harbor Moment

By: Keith Kaplan

4 years ago | Investing StrategiesNews

Today, many of us already think of the COVID-19 pandemic as another tragedy that “will live in infamy.” And while the pandemic and Pearl Harbor are very different in many ways, one thing is clear. Historians will look back at both as the beginning of considerable changes to our society and economy.

Read Full Article Array
Featured

So This Is Tesla’s Secret Weapon?

By: Keith Kaplan

4 years ago | News

Today, I want to highlight a few advancements in Tesla’s battery storage business and explain why Tesla is quickly maturing into more than just a car company.

Read Full Article Array
Featured

Another Warning Sign in The Market?

By: Keith Kaplan

4 years ago | EducationalNews

The central bank is poised to start the processing of tapering its balance sheet. However, the market doesn’t seem to be reacting negatively to the news. But I want to highlight yet another warning sign flashing red for the market. Let’s talk about the Fed, and then highlight this “alternative” signal for investors.

Read Full Article Array
Featured

Don’t Get Mad… And Don’t Get Even

By: Keith Kaplan

4 years ago | EducationalInvesting Strategies

This market has been sideways for several months. And this one rule will help you better manage your money.

Read Full Article Array
Featured

What to Make of the Cannabis Bear Market

By: Keith Kaplan

4 years ago | News

If you’re a buyer and holder of cannabis stocks in recent months, you need to read what’s happening in this industry.

Read Full Article Array
Featured

Rule One: Don’t Do This When It Comes to Owning Stocks

By: Keith Kaplan

4 years ago | EducationalInvesting Strategies

When it comes to buying and owning stocks, there is one rule you must follow: Don’t fall in love with the companies you buy. They won’t love you back.

Read Full Article Array
Featured

From Bad to Worse: Alibaba’s Future Looks Uncertain

By: Keith Kaplan

4 years ago | News

If this is a stock in your portfolio, you need to read the cold hard truth that I’m about to tell you. And if analysts are trying to convince you that now is the time to buy Alibaba… you also need to read this. It’s not time to touch this stock yet. Here’s why.

Read Full Article Array
Featured

​​This ‘Liquor Store’ is the Next Great COVID-19 Trade

By: Keith Kaplan

4 years ago | EducationalInvesting Strategies

In 2016, a company you don’t associate with alcohol generated $1 billion in booze sales. Why am I pointing this out? Because this random fact drew my attention to a real buying opportunity.

Read Full Article Array
Featured

Low-Risk Strategies Part 3: Get Paid for the Stocks You Want to Own

By: Keith Kaplan

4 years ago | EducationalInvesting Strategies

Today, I want to show you one of the most exciting ways to own some of the strongest, lowest-risk stocks. You get paid to pick your entry price. And you play a simple waiting game. You will do this by selling something called a cash-secured put, and it’s one of the easiest ways to trade options successfully.

Read Full Article Array
Featured

Yes, You Can Own Amazon Stock for $15

By: Keith Kaplan

4 years ago | EducationalInvesting Strategies

Many first-time investors think they’re priced out of an expensive blue-chip stock because they can’t afford a single share. But there is a solution…

Read Full Article Array
Featured

How NOT to Invest in Rising Oil Prices

By: Keith Kaplan

4 years ago | Educational

Yesterday, I discussed the two best ways to invest when oil prices remain elevated. Today I want to show you two funds that you should avoid. These can act as weapons of destruction for your portfolio if you don’t know the rules.

Read Full Article Array
Featured

Here’s the Right Way to Play Rising Oil Prices – Part One

By: Keith Kaplan

4 years ago | EducationalInvesting StrategiesNews

Remember about a year ago when oil crashed? No one wanted oil. Supply was abundant with no demand. Fast forward just a year and oil is now in a raging bull market. But I’ve learned there are right ways to trade the rising price of oil and wrong ways.

Read Full Article Array
Featured

Stock Market Myth 3: ‘You Need a Lot of Money to Invest’

By: Keith Kaplan

4 years ago | Educational

Last week, we discussed two persistent myths about the market. Today, we’re back to debunk one that is downright infuriating. It’s the belief that you need a significant amount of money to be a successful investor.

Read Full Article Array
Featured

Another Way to Lower Risk and Squeeze Gains in the Market

By: Keith Kaplan

4 years ago | EducationalInvesting Strategies

If options aren’t for you, I have another conservative strategy to help you manage your risk and build a rockstar portfolio of stocks. During choppy periods of the market, I encourage you to build your portfolio using a simple strategy called “dollar-cost averaging.”

Read Full Article Array
Featured

Myth Busting No. 2 – They Say You Can’t Beat the Market… But You Can

By: Keith Kaplan

4 years ago | Educational

On Wednesday, we discussed the common myth that cash is safer than stocks. Today I’ll debunk the argument that you can’t beat the market.

Read Full Article Array
Featured

How to Boost Gains from Stocks You Already Own – Part One

By: Keith Kaplan

4 years ago | EducationalInvesting Strategies

Today, I want to spend a little bit of time talking about ways to earn more money from your existing stock portfolio. We’ll start today with one of the most conservative and defensive ways to use options, generate income, and limit your downside risk.

Read Full Article Array
Featured

Debunking Market Myths – ‘Cash Is Safer than Stocks’

By: Keith Kaplan

4 years ago | Educational

This week, I’m busting several of the biggest misconceptions about the stock market. I’ll start with the biggest doozy of them all. The belief that sitting on cash is SAFER than owning stocks.

Read Full Article Array
Featured

Here’s a Different Way to Value Stocks and Find Great Buys

By: Keith Kaplan

4 years ago | EducationalInvesting Strategies

There’s another way companies can return money in the form of value: through mergers and acquisitions. By buying out smaller rivals or strategically aligned companies, companies can boost their enterprise value, and create new business lines and synergies that return larger gains over the long term.

Read Full Article Array
Next Page » « Previous Page

Low-Risk Strategies Part 3: Get Paid for the Stocks You Want to Own

By: Keith Kaplan

4 years ago | EducationalInvesting Strategies

Last week, I outlined two of my favorite ways to squeeze every penny from the stocks in your portfolio.

But what about the ones you WANT to own, but don’t yet have in your portfolio? Is there a way to use leverage to enter positions of great companies with limited risk?

Of course. I want to show you one of the most exciting ways to own some of the strongest, lowest-risk stocks.

You get paid to pick your entry price. And you play a simple waiting game.

If the stock never hits that target price, you get to pocket the cash.

If it does, you get the stock at the price you chose.

You will do this by selling something called a cash-secured put, and it’s one of the easiest ways to trade options successfully.

Let’s dive right in.

Another Way to Play Low Risk Runners

This morning, I logged in to TradeSmith Finance and looked at the latest stocks in the Low Risk Runners strategy.

Here are the criteria that qualify a stock as a Low Risk Runner:

  • Its Health Indicator recently moved from the Yellow Zone back to Green
  • The position has an average VQ of less than or equal to 40%
  • The stock is trending up or sideways, which means that momentum has been rising

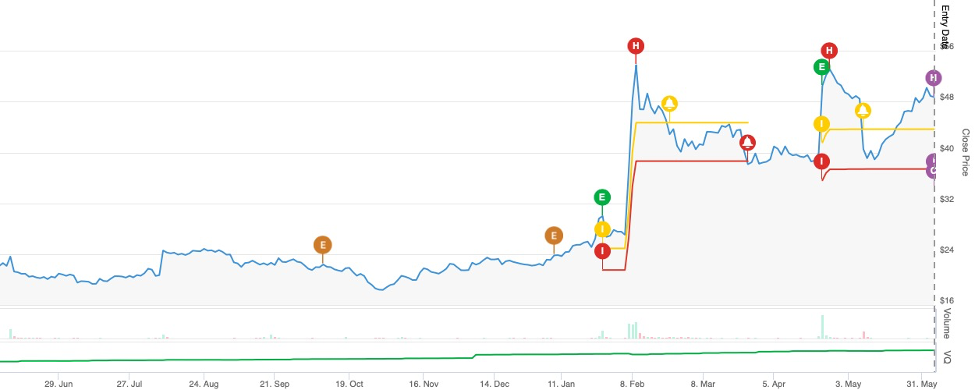
A company that jumped out at me was Teradata (TDC).

Today, it’s trading just under $48.81. That isn’t a terrible price for the company.

According to our signals, the stock is in the Green Zone, is in an uptrend, and it only has medium risk.

If I want to buy 100 shares of Teradata stock, I’d have to pay $4,880.

That’s a hefty price.

But with a cash-secured put, I could get paid – today – to purchase the stock at $45 per share.

Seriously.

Another Way to Trade Low Risk Runners

In simple terms, a cash-secured put allows you to make money on stocks that you want to buy at the price you’re willing to pay.

Sounds too good to be true, right?

Let me say one thing upfront.

You will need to contact your broker to ensure that you have clearance for this opportunity.

You’ll need Level 1 options clearance. This is the lowest level of approval and ensures that you have the proper margin to trade (more on this in a moment).

Now, let’s quickly go over a few key elements of puts. I am going to be using some personalities to explain this. Mark is our put seller, and Bob is our put buyer.

  • Put Option: This option allows Bob to sell 100 shares of stock for every put contract that he owns. The strike price and expiration date define the contract (see below). Mark would be selling Bob a contract that allows Bob to sell his stock to Mark at a specified price if the stock goes lower.
  • Strike Price: The strike price is the price at which the options contract can be exercised by Bob. In our Teradata example today, the strike price would be $45.00. Since we are working with a put option, the stock would need to drop to or below $45 for Bob to execute the contract.
  • Expiration Date: This is the date that the put contract expires. The stock must trade under the strike price of $45.00 by the expiration date for Bob to execute it. If the stock falls under that level, Bob may execute the contract at any time and sell his shares to Mark. However, if it never falls under the strike price, the contract will expire worthless. In that scenario, Mark, as the seller of the contract, gets to keep the premium; However, Bob keeps the stock.
  • Premium: This is the amount of money that Bob pays Mark for the right – but not the obligation – to sell the stock to Mark in the future at the strike price.

In this scenario, Mark agrees to buy 100 shares if Bob executes the contract.

Now, the “secured” part of this trade is simple.

When Mark sells the contract, his broker will require him to post a margin.

This is like a security deposit.

Mark will need enough money in his account to buy Bob’s 100 shares of the stock if it falls under the strike price. Those margin levels will fluctuate depending on the value of the stock.

This margin also significantly reduces the amount of money that Mark could lose.

So, let’s look more closely at Teradata.

Here’s a Great Example of How to Sell Cash-Secured Puts

I am looking at the options chain for Teradata.

The September 17 $45 put trades between $3.00 and $3.20 currently.

Let’s say that Mark sells one $45 put on this expiration date.

This means that Mark will sell a contract that gives Bob the right to sell 100 shares on or before that date. If Mark sells the put for $3.10 per share, he will pocket $310 (the premium times 100 shares).

If the stock does not fall below that level and/or Bob doesn’t execute the contract by that date, Mark will keep all of that premium.

If the stock does fall to or below that level, Mark will get to purchase 100 shares of Teradata for $45 per share. So again, Mark has picked his preferred entry price.

And, as you can see in the chart below, the options contract price is still in the Green Zone.

But here’s the best part. Mark gets to keep that premium no matter what.

So, if the stock falls to $44.00 and Mark buys it for $45, you might think that Mark is down on this trade.

Not so. Subtract the premium from the stock price. Let’s do the math.

$45.00 minus $3.10. This gives Mark a breakeven trade price of $41.90.

Mark will be up $2.10 per share if the stock is at $44.00.

At $3.10 right now, if Bob chose to execute the contract at $45, Mark would  have also generated about a 6.8% return on his money over the next 102 days. That’s quite a deal and one worth consideration.

And speaking of opportunity. I’ll be back tomorrow to talk about treasure.

Yes, real treasure that you can spot on a map and profit from immediately.

Yes, You Can Own Amazon Stock for $15

By: Keith Kaplan

4 years ago | EducationalInvesting Strategies

Here’s a common problem for first-time or more passive investors.

They’re interested in buying a blue-chip or red-hot tech stock.

But each share trades at a price they think they can’t afford.

Maybe you’re an investor who wants to start investing with $500 today.

But this week, Amazon (AMZN) shares cost more than $3,200 each.

Alphabet (GOOGL) – the parent company of Google – stock costs more than $2,300 per share.

Or take Domino’s Pizza (DPZ). One of the most popular pizza-delivery companies of all time traded for $426.25 (and higher) as of this morning.

You likely think you’re priced out of the first two stocks above.

And you’d only be able to buy one share of the pizza company with that initial investment. It sounds like a raw deal and it’s one reason people believe that you need a lot of money to start investing.

Well, there is a solution.

It all starts… as it should… with a pizza.

How About a “Slice” of Domino’s?

Domino’s Pizza has been around since 1960. It’s best-known for its pizza.

But it should be known for its delivery. The company’s innovations in food delivery are precursors for technologies used today by Uber Eats, GrubHub, and many other companies. For example, Domino’s recently built a massive innovation center to create and test new delivery systems to get pizza to you faster.

Don’t laugh. It’s true.

Shares of Domino’s Pizza have been on an incredible run over the last few years. The company’s stock is up from nearly $200 at the start of 2018 to more than $426 just three and a half years later. That’s a 113% return in about 41 months.

Now, if you started with $500 and bought two shares in 2018, your gains would be enough to order enough pizza for a typical child’s birthday party.

Two years later, you can only buy one share… right?

Well, thanks to innovation elsewhere in the markets, investors can now buy something known as fractional shares of a company. It starts with a brokerage that purchases whole shares of a stock on the market. They then cut the stock into whatever fractions their clients want and keep that division noted on their books.

Think of each stock as a pizza. You can purchase based on a percentage of a share — or a dollar amount — instead of buying an entire share.

So, you could purchase $500 of Domino’s stock and obtain roughly 1.17 shares of this company. Now, instead of leaving nearly $85 on the sideline in your brokerage account, you can put that money to work and earn both dividends and appreciation upside by investing that capital.

Or, in the case of Amazon — trading north of $3,300 — you could put $20 or $200 into fractional shares of this leading e-commerce company.

Fractional shares give you the ability to buy a stock that you couldn’t previously afford. In addition, you can slowly build a diverse portfolio, stretching your stake across various companies.

As I noted on Monday, dollar-cost averaging is a unique way to build an individual position or a broader portfolio.

Let’s look at some other pros and cons of fractional shares.

Pro: Build a Portfolio as You Learn to Invest

With dollar-cost averaging, you could allocate $5, $100, or $500 per month to the stock or stocks of your choice. So, if you’re just starting to invest, you can set money aside on your schedule, invest in your favorite companies, and build a nest egg at your own pace. You don’t need a lot of money to get started, and you can generate income off your principal.

Pro: Accessible on Many Different Brokerages With Zero Fees

Fractional shares are available in many different forms at many brokerages. Robinhood, for example, was the first broker to offer commission-free trading. The brokerage platform also implemented new features like fractional-share investing and automatic dividend reinvestment.

Meanwhile, firms like Stockpile allow investors to purchase fractional shares as a gift for family and friends. It’s like a gift card that can be used for fractional shares or ETFs (with certain fees). Other options include Stash and Public.com

Con: You Might Not Be Able to Transfer Fractional Shares

The primary challenge with these brokerages is that you may not transfer them to a different broker. Typically, it’s easiest to transfer entire shares, meaning that you might have to sell them and transfer the cash. This can create uncertainty with capital gains taxes, an uptick in fees, and other costs you might not know about today. Therefore, it’s essential to read all of the documentation if and when you trade fractional shares.

Con: You Can’t Invest in Many Foreign Companies

In the United States, fractional shares have gained popularity. However, they remain elusive in Europe, Japan, and other markets. So, you may not have the option to buy some of the bigger competitors of the U.S. companies.

Fractional shares are a remarkable way to buy more than a whole share and ensure you can generate additional income and appreciation upside with your money. It’s also a great way to own the companies that you want to own on your terms.

Here’s my favorite part: fractional shares allow you to buy great businesses at an affordable price so that you can keep your portfolio balanced (risk-adjusted) and not be overleveraged in any one position.

I will beat that drum hard… all the time. Do not put too much money into only one position. Fractional shares are a perfect way to put just the right amount of money into each position you enter.

On Monday, I’ll show you another way to buy the stocks you want to own at the price you want to pay. It’s a great strategy, and one that can help you generate additional income off stocks.

How NOT to Invest in Rising Oil Prices

By: Keith Kaplan

4 years ago | Educational

I like a fast dollar just as much as everyone else.

But I’ve watched enough videos about the street hustle known as three-card monte that I know there’s always a catch with something that seems too good to be true.

In the case of rising oil prices, I regularly see investors speculating on various funds and other assets that are extremely dangerous. Yesterday, I discussed the two best ways to invest when oil prices remain elevated. As long as these companies remain in the TradeSmith Finance Green Zone, they remain strong buy-and-hold candidates.

But today I want to show you two funds that you must avoid.

These can act as weapons of destruction for your portfolio if you don’t know the rules.

Oil Trade to Avoid: The United States Oil ETF (USO)

It’s incredible to think that last year, U.S. oil prices went into negative territory. West Texas Intermediate, the North American benchmark, fell to minus $37.63, a record low.

At that point, producers were forced to pay “buyers” to take crude (or just get rid of it) as there was a massive oversupply at delivery points and a lack of storage.

For investors investing in oil companies, April 20, 2020 – the date of this historic slide – will live in infamy. As oil prices have steadily recovered over the last year, energy investors have seen stronger balance sheets and improved margins.

But for investors of the United States Oil ETF, every day is a roller coaster.

This ETF is rumored to track the price performance of spot U.S. oil prices.

But that’s just not true. It’s never meant to track spot oil prices in the U.S.

And this is why the commodity ETF should have a warning akin to a skull and crossbones pop up on the screen before you can click the “Buy” button.

This ETF aims to track the front-month futures contract for oil. Unfortunately, the mechanics of commodity ETFs can be a bit complex for the average retail investor. You see, these funds must constantly buy and sell futures contracts to “track” the price of the front-month contract.

They also have a “time value” – similar to what we see in options trading – that evaporates as we move closer to the date of the contract’s expiration.

Let me make this clear – if the price of oil were to stay exactly the same every day, the ETF would slowly decay and fall.

Now, keep in mind that most commodity futures contracts are not meant for wild speculation by anyone who isn’t prepared to take physical delivery of the actual underlying commodity on the expiration date. If they don’t execute these contracts, the ETF rolls them over.

So, unless you’ve got a cavern sitting around or a massive storage container in Cushing, Oklahoma (the delivery point for the NYMEX Light Sweet Crude oil futures contract) it’s not best to be diving too deep into this futures market.

The problem is that this commodity ETF is actively issuing new shares, buying and selling contracts, and thus increasing the cost of ownership. In some cases, investors must pay a premium to own this fund. And worse, there are days when the price of oil will rise, yet the price of this fund will fall because of those high costs that I’ve mentioned.

In 2016, the price of oil increased by 45%, its largest increase in seven years.

Yet USO dropped by 4% through the first 11 months of the year before staging a late-December rally to finish up on the year by just a little more than 6.5%.

And while oil prices have rallied over the last year, take a look at where USO sat in December 2019. It was more than twice as high as the closing price on Wednesday.

That drop comes despite the news that WTI crude oil is trading higher today than it did on average during December 2019. Those are not good returns for an ETF that is supposed to be tracking a commodity’s price.

By comparison, ConocoPhillips (COP), an independent oil producer that I mentioned yesterday, finished the year up 18.6%. Meanwhile, Diamondback Energy (FANG), also an independent oil company, rallied more than 67% in 2016.

Despite all of my concerns that I’ve listed – and the detachments from oil price – the USO ETF remains very popular with investors. It has more than $3.2 billion in assets, and many people continue to use it as a speculative tool. As a result, there is ample speculation surrounding futures, and it can create an amplified herd effect where people sell contracts in droves.

Oil Trade to Avoid: Leveraged ETFs

If the USO is a potential time bomb waiting to go off in a retail investor’s portfolio, then let me introduce you to the nuclear explosion that can wreck your principal.

A traditional ETF – not a commodity ETF – is a pooled mutual fund. A fund manager purchases a basket of securities, most likely stocks. That ETF will try to track or replicate an underlying index and meet a similar performance to its benchmark over a period of time.

However, a leveraged ETF can offer the allure of a 2x, 3x, or even 4x return. So how do they aim to accomplish this? These products use derivatives and debt to attempt to multiply the return of the benchmark that it tracks.

But there’s always a catch. In this case, there are larger-than-average expense ratios and extremely fast decay in the fund. In addition, you’ll pay trading costs, custody fees, and interest expense. Those fees add up quickly and can eradicate the value of your position very quickly, especially because the portfolio must rebalance daily.

Leveraged ETFs might make investors think that they can obtain an 8% to 10% return in a day. But these do not help investors preserve capital. Instead, one bad day for a leveraged ETF can lead to the loss of an entire position.

In addition, that decay and leverage make it very difficult to buy and hold these positions for more than 24 hours. 

Now, I know what you’re thinking. What if I want to speculate on these funds and hold them for a longer period than a few days? After all, one can look at this chart and argue that shares of the ProShares Ultra Bloomberg Crude Oil ETF (2x) (UCO) have rallied like this since January.

The UCO is up 99% since the start of the year.

That’s very intriguing, but it’s also hindsight.

If you stretch it out over the last three years, you’ll see a fund that is actually DOWN more than 88% since the start of 2018.

That could spell a wipeout to a portfolio!

Yes, it’s OK to speculate. But if you’re going to buy and hold, consider oil producers and master-limited partnerships (MLPs) that will pay solid dividends and provide greater upside from growth factors in the energy industry.

One more thing, because I know I’ll get asked this question… if you follow an analyst who hasn’t steered you wrong and they recommend one of the funds mentioned – go for it.

But, watch their advice closely on when to exit (or follow your TradeStops Health Indicator or VQ stops). And make sure the position size is right and you track it in our system so that you have a stop-loss alert on it. Don’t get in trouble speculating! I’ll be back tomorrow to talk about how you can get started investing with less than $50 on some of your favorite stocks – even if the share price is well above that figure.

Here’s the Right Way to Play Rising Oil Prices – Part One

By: Keith Kaplan

4 years ago | EducationalInvesting StrategiesNews

Remember about a year ago when oil crashed? No one wanted oil. Supply was abundant with no demand.

Fast forward just a year and oil is now in a raging bull market.

There are fund managers and oil traders with decades of experience buying and selling crude around the globe right now.

They’re trading barrels across offices in Houston, London, Dubai, and Geneva.

They’re moving millions, if not billions, of dollars on single trades.

They’re so attuned to the global crude market, they likely know the names of individual pipelines in countries like Saudi Arabia, Belarus, Mexico, or even Thailand.

And they can even tell you the length and storage capacity of huge oil tankers like the Seawise Giant, Bellamya, or Batillus.

Well… chances are… you’re not one of those traders.

And neither am I.

But I’ve learned there are right ways to trade the rising price of oil and wrong ways.

So, what do you say we discuss these options instead of that new pipeline in Angola?

Why Are Oil Prices Rising?

On Tuesday, global oil prices rallied once again.

The price of West Texas Intermediate (WTI) crude – the benchmark for North America – rose 2.5% and nearly closed at $68.00.

Meanwhile, Brent crude (the global benchmark) increased by nearly 2% and closed at $70.69. This price was a two-year high for crude.

WTI crude is typically sourced from landlocked North American oil fields, while Brent comes from the North Sea above central Europe. WTI crude is “sweeter” than Brent, but I’m not talking about sugar. The term “sweeter” means that it contains less sulfur, making it more ideal for refining into products like gasoline, plastics, and diesel fuel. There are many other factors that we’ll consider in future Daily issues.

For now, let’s focus on a few factors that drove oil prices higher in recent weeks.

First, the summer driving season is well underway. This seasonal factor is important because oil demand is typically higher in summer travel seasons than during the winter (with the exception of last summer’s COVID-19 slump, of course).

In addition, more and more states and countries are reopening.

Demand for oil is back on the mend, and the more robust the recovery, the faster we’ll see crude consumption increase. There are other important demand metrics in oil such as economic growth, changing demographics, and commercial and personal transportation.

But think back to your Economics 101 class.

Demand is only one side of the global crude market equation.

Supply is the other critical component.

Globally, supplies have been intentionally constrained by major market participants over the last year. After all, if supplies are very high at a time when demand is low (say in the middle of a pandemic), that’s bad for oil producers who might end up selling their product at a loss to their production costs.

There are a lot of politics involved in the global crude market, and there has been an interesting battle between U.S. producers and their foreign competitors over the last decade.

That’s also a subject for a different time.

What matters the most in recent days is a statement by OPEC that could keep crude prices moving higher in the coming weeks.

Why OPEC Matters

OPEC is a global energy cartel that controls the production of crude across its 13 member nations that include Iraq, Saudi Arabia, Venezuela, and Libya.

The cartel has also aligned its interests with Russia to work together to keep supply constrained around the world in order to help support higher crude prices.

Think about what they are doing. By working together to limit the amount of supply that each pumps, they artificially limit crude on the global market.

Why do they matter? Because they constrain the production for their member nations. OPEC accounts for nearly 40% of global oil production. In 2018, these countries also sat on top of 79.4% of global proven oil reserves.

Every few months, these nations’ oil ministers gather to discuss the best course of action to elevate prices, manage production output, and predict global demand.

In the face of COVID and the ensuing plunge in demand – OPEC and oil-producing allies like Russia (which is called OPEC+) decided to cut production by 9.7 million barrels last year.

As demand slowly improved, they eased those cuts by the start of 2021 to 7.2 million barrels. Now they aim to bring another 2.1 million barrels back online.

While they will still be down about 5.8 million barrels compared to the start of the crisis, the elevated price points will allow the member nations to make money while they wait for pre-pandemic demand to return.

Despite those cuts, oil prices are up about 30% since the start of the year.

However, some analysts (including our own Chief Research Officer, Justice Clark Litle) are projecting that oil will continue to rise.

Goldman Sachs said last week that it expects Brent crude to hit $80 later this year. In fact, the bank believes crude prices will rise despite efforts by OPEC to bring Iran’s crude exports back online. Iran has been unable to bring crude to markets due to sanctions related to its nuclear weapons program.

President Joe Biden aims to reinstate a deal between the U.S. and Iran that was torn up by the previous administration.

Iranian crude exports, however, are subject to management by OPEC. Though Iran may soon aim to bring 2.5 million barrels back online to the global market, OPEC will likely ensure that these exports deliver in a structured manner and don’t impact the global supply-and-demand balance.

If crude prices are set to rise, there are two ways to play an uptick in prices that I’d like to highlight.

Here’s How to Play Rising Oil Prices

If we’re going to speculate on oil prices remaining higher for longer, there are a few smart ways to invest. And a few ways you should avoid.

Professional traders and hedge funds are the dominant players in the oil futures markets. Unless you understand how contracts and leverage work, steer clear of exchange-traded funds (ETFs) linked to the oil price and consider these two options instead.

Option 1: Oil Exploration and Production

It sounds almost too simple, but that’s because investing in oil producers just makes sense. Companies that pump crude from the ground sit on large fields that are full of oil. In addition, they sell their crude to the markets and generate gobs of cash. The higher the price of crude, the more valuable their fields and available products are.

There are multiple types of oil producers. U.S. companies like Exxon Mobil (XOM) and Chevron Corp. (CVX) are considered “majors.” (Note: TradeSmith Finance indicates that both are in the Green Zone and maintain an uptrend in momentum.)

They stand among the largest global oil producers and compete directly against large, state-owned producers like Saudi Aramco (Saudi Arabia), Petrobras (Brazil), and CNPC (China). They also compete against large multinationals like Total (TOT) and RoyalDutch Shell (RDS.A).

These companies tend to own large swaths of reserves around the globe and are less subject to the wild swings of crude prices due to the production or breakeven prices of their many fields. In addition, these companies are more likely to be vertically integrated and own storage, refineries, and other assets further down the supply chain.

Meanwhile, a large roster of other companies is known as “independents.” These companies don’t integrate and tend to focus on one specific element of the oil and gas industry. The IRS identifies these companies as those that don’t generate more than $5 million in retail sales of oil and gas each year. In addition, they do not refine more than 75,000 barrels of crude per day in a year.

Examples include ConocoPhillips (COP) and Marathon Oil (MRO). Like their major cousins, both oil independents sit in the Green Zone and maintain uptrend momentum.

Option 2: Master Limited Partnerships or MLPs

Long-term investors looking for exposure to the oil-and-gas sector should not overlook master limited partnerships. These companies don’t offer exposure to futures contracts and don’t even require you to look at oil reserves on a producer’s balance sheet. Instead, these firms own pipelines that pump crude from one place to the other. There are multiple reasons why MLPs are attractive investments, but I want to highlight the most important one.

They are considered alternative investments due to their tax structure. MLPs operate under a partnership structure that allows them to avoid payment of corporate taxes. Typically, shares are taxed two times, first at the corporate level and second at the investor level, when a shareholder pays capital gains taxes.

With MLPs, these companies avoid corporate taxes as long as they generate at least 90% of their revenue from “qualified” sources like natural gas or oil. These tax-preferred structures originated in the 1980s to encourage investment in U.S. natural resource development. Investors receive a quarterly distribution from the fund manager or distributor. Investors also receive a nice pro rata share of the depreciation allowed to the MLP by the government.

Examples of MLPs include Enterprise Products Partners (EPD), Magellan Midstream Partners (MMP), and MPLX (MPLX). All three provide dividends north of 7.4%, trade in the Green Zone on TradeSmith Finance, and remain in an uptrend momentum to start June.

If you’re bullish on crude oil, add them to your watch list and think about the best options that fit your risk-reward profile.

It’s simply amazing to me how much the world has changed in a year. We went from a booming economy to a screeching halt. Oil suffered dramatically, but it’s back.

And a lot of people lost a lot of money in oil stocks, ETFs, and futures.

So pay attention, because tomorrow, I’ll explain two ways of investing in this trend that you should avoid.

Trust me, these are not for the faint of heart, and you’re better off playing long-term energy companies that pay dividends and can appreciate over time instead of speculating on short-term price moves.

Stock Market Myth 3: ‘You Need a Lot of Money to Invest’

By: Keith Kaplan

4 years ago | Educational

How do some of the myths about the stock market even start?

One would guess it comes from simple perception.

We discussed two persistent myths last week (Myth 1: Cash is Safer than Stocks, and Myth 2: You Can’t Beat the Market). But the one we need to debunk today is just downright infuriating.

It’s the belief that you need a significant amount of money to be a successful investor.

That couldn’t be further from the truth.

You don’t need $1 million to start investing the right way.

You don’t even need $1,000.

All you need is a small stake and the right level of confidence.  

Not Everyone Needs to Be Accredited

The stock market is not just for rich people. It’s not just for brokers and people with big boats sitting off the docks of Manhattan or Miami.

The stock market should be a genuine wealth-building tool for America’s middle class.

It hasn’t helped that three major financial crises occurred in the last 20 years. The dot-com bubble, the Great Financial Crisis of 2008, and the Covid Crash of 2020 have turned many 401(k)s into “201(k)s.”

These sharp downturns have impacted confidence in the U.S. and global markets. As a result, middle-class investors – who are typically loss averse and very prone to selling stocks in times of crisis – have walked away from stock market investing.

The numbers are pretty staggering today about who owns stocks and who does not. The field of those still invested skews toward high-net-worth investors.

In 2021, the top 10% of Americans by wealth owned an average of $969,000 in stocks. The next 40% owned just $132,000 on average. The bottom 50% was under $54,000. These numbers come from the blog Financial Samurai.

But dig deeper, and you can see that stock ownership is not as common as it used to be. In 2007, roughly 66% of Americans owned stock.

Today, that figure is roughly 52% and falling.

Wall Street, meanwhile, isn’t as engaged in bringing more Americans into the market. Hedge funds, private equity firms, family offices, and certain institutions are typically designed for accredited investors.

Who is an  “accredited investor?”

These are individuals who only qualify for certain asset classes that are heavily focused on the markets. Accredited investors must earn at least $200,000 per year or have a net worth (minus their primary residence) of $1 million or more.

Big banks and big money managers love these investors because they generate massive fees for their bottom line.

But they’ve also contributed to the ongoing consolidation of wealth among the wealthiest people in America. According to New York University economist Edward Wolff, the top 1% of households in the U.S. own 38% of the stocks.

No wonder there is this ongoing misconception that the stock market is a machine built for rich people only.

However, don’t buy into the myth. The stock market is your tool to find success and build wealth. Here’s how to do it.

Start Small, Trade Small

If you are out of the market or just starting to dip your toe into it for the first or second time, you’re in the right place.

You see, you should start small if you’re learning how to trade and invest. And even if you do have a lot of capital, you shouldn’t just dive into the markets with both feet.

I’ve had many conversations with people about where and how to start investing. And I always try to get people to think in terms of “rules.”

Rule one: Don’t think that you don’t have enough money to get started.

For example, I listen to people say that they need to hit a particular savings milestone before they start investing. Some people say they need $10,000 or $15,000 in their savings account before they start investing.

No. Start now.

Instead of putting $100 or $200 away each week or month into a savings account, put it in the market. The savings account will pay you a paltry 0.08% interest, which is lower than the inflation rate. You’re actually losing purchasing power by parking your money in that savings account. 

Think of it this way… you’d need 866 years to double your money at 0.08%.  If you were earning 10% a year, you’d need just over seven years to double your money.

There are undervalued companies that you can buy for $50 or $100. Their stocks might be trading even lower than the amount of money you have to start building a portfolio, which allows you to buy multiple shares. If you have $50 and the stock is at $5, buy 10 shares.

If you have $50 and it trades at $10, buy five shares.

How to Pick Your Favorite Starter Stocks

You do not need to worry about buying every single stock that interests you at once. Start with a few ideas and pick your best ones.

You can think about a few straightforward metrics that will help you decide which stocks you might want to buy. Set your list of ideas, but think about these questions.

  • Which stock has the most growth upside?
  • Which stock offers strong dividends that can boost my return and beat inflation?
  • Which stocks are the safest and allow me to invest for the long term?

I will dig deeper into metrics like Return on Equity and profitability ranks to answer the first question in future issues. I’ll talk more about cash flow and Dividend Aristocrats to answer the second. For the third, consider TradeSmith Finance as a tool to give you a clear indicator of what is a buy and what is a sell. If a stock is in the Green Zone, you can invest with confidence.

If you don’t want to focus on stocks, you can also choose index funds. If you buy the S&P 500 index fund (SPY), you are buying a fund that replicates the performance of the largest publicly traded companies in this index. That’s a more passive way to invest for the long term and ride the historical, upward bias of the markets.

The SPY currently trades north of $400, but it is possible to purchase fractional shares and build your position accordingly. I’ll discuss the risks and rewards of fractional shares later this week.

But for now, have confidence in the fact that the markets are not just for the wealthy.

They are your tool to turn $25 into $50… or $100 into $500 over the long term.

Shoot for 10% annual returns over time. It may not sound like much, but I can tell you that overnight doubles don’t happen to people just starting out. Typically, you can expect overnight massive losses with the wrong starting mindset. We’ll be back tomorrow to talk about how to trade rising oil prices.

Another Way to Lower Risk and Squeeze Gains in the Market

By: Keith Kaplan

4 years ago | EducationalInvesting Strategies

Last Thursday, we discussed a very conservative strategy to boost your income and increase the odds of beating the market.

This simple options strategy is known as “selling covered calls.”

But if options aren’t for you, I have another conservative strategy to help you manage your risk and build a rockstar portfolio of stocks.

It doesn’t matter if you’re on par with Warren Buffett or a first-time investor. Regardless of experience, we all need a strategy to improve our odds of success.

During choppy periods of the market, I encourage you to build your portfolio using a simple strategy called “dollar-cost averaging.”

What is it? And what are the benefits?

I’ll keep this lesson short on Memorial Day. So, let’s dive in.

Defining Dollar-Cost Averaging

Dollar-cost averaging is a simple process.

Here you buy a proportionate number of stock shares in different blocks.

You purchase them once a month, once a quarter, or in another predetermined period. It’s entirely up to your discretion.

Investors use this strategy to minimize the impact of stock market volatility.

Instead of buying all of the shares at once, investors can break their purchases into smaller buys until they exhaust the capital allocated to a particular asset.

So, for example, let’s say that you have $20,000 and want to buy shares of a stock. Let’s look at how you might improve the overall performance of a portfolio.

In the example below, you have $20,000 and two options.

The first option is to purchase a one-time lump sum of 800 shares at $25 each. This exhausts all of the money from the account.

In scenario 2, you break up the purchases into 10 weekly buys. In this case, you buy as many shares as possible with $2,000.

On the right side of the chart, you see that you could purchase a different number of shares each week depending on the movement of the price.

As you can see, the second option produced a situation where the dollar-cost averaging allowed you to end up with a larger number of shares (822 compared to 800) by the end of the period. Naturally, the dips in the stock price in the first few weeks allowed the investor to buy more shares with the $2,000 allocation.

So, even though the stock surpassed the $25 level in the final three weeks, the early volatility and decline made a big difference. In this example, you end up with 22 more shares using the same amount of capital.

Pay attention to the final line. Let’s say hypothetically that the stock was to increase to $28 a share a few weeks later. Since the first strategy had a stagnant purchase price of $25, you make a net $3 per share on the gains — 12%. That translates into about a $2,400 gain over the next five weeks.

But in the second scenario, dollar-cost averaging allowed the investor to purchase shares at an average of $24.45. Therefore, the investor gains more over the next five weeks — a return of 14.5% (or $2,918.10). And — as a result of this strategy, the second option generated $616 more over the 10-week period compared to the first strategy.

Now, it’s possible that the stock could decline. Of course, there is risk in this scenario. Well, let’s say that by week 15, the stock falls to $24 per share. In the first option, you would be down $800 or 4% on the original investment.

But the second scenario produces smaller losses. Since you averaged each purchase at $24.45, you would be off $369.90 from the combined investment of $20,097.90. This represents a loss of just 1.84% in total.

How to Use This Strategy

So, how can you use this strategy right now?

Well, it starts with using TradeSmith Finance.

You can look at various stocks on our platform. As always, you’ll want to buy shares in the Green Zone. As long as they remain in the Green Zone, you can purchase shares with confidence and build your position.

Should they fall into the Yellow Zone, don’t do anything. Wait to see if it trades back in the Green Zone and invest with confidence in your next batch of stocks.

And if it does fall into the Red Zone, exit your positions and reallocate your money elsewhere.

I will be back again tomorrow with another myth that investors need to ignore. It involves the size of your positions and portfolio.

Trust me, you don’t want to miss it. Have an excellent end to your holiday weekend.

Myth Busting No. 2 – They Say You Can’t Beat the Market… But You Can

By: Keith Kaplan

4 years ago | Educational

There’s no shortage of common misperceptions that lead retail investors to doubt their own capabilities.

On Wednesday, we discussed the common myth that cash is safer than stocks.

We know that’s baloney.

Want another myth? It’s the argument that you can’t beat the market.

Why does this myth exist? Why are so many people convinced they can’t outperform the S&P 500, the popular benchmark for performance comparisons?

And what can you do to beat the market more years than not?

I’ll break this myth in half and show you a few tricks to increase your odds of success in beating the market in 2021 and beyond.

Why Does This Myth Exist?

It’s not easy to beat the market.

Let’s get that out of the way.

But it’s not impossible. Setting expectations is very important as an investor.

There are many famous money managers who can’t beat the market on a regular basis. Perhaps the most famous, Warren Buffett, trailed the performance of the S&P 500 in 2019 and 2020 combined by 37%.

Meanwhile, even the streakiest performers like former Legg Mason value specialist Bill Miller have off years. Although Miller beat the S&P 500 every year from 1991 to 2005, his fund lost more than 66% of its value in 2008.

Miller has since recovered, but it is important to remember that you’re very unlikely to top the market every year.

But can you beat the market in 2021 or 2022? Absolutely.

This myth exists for a variety of reasons that are largely outside of your control. Fund managers who typically don’t even beat their own benchmarks will still use this myth as a marketing message.

It’s common to tell investors that they can’t beat the market themselves and that they need professional help.

Yet, the messaging is flawed. Managers tend to make the same errors most investors do.

In 2012, the National Bureau of Economic Research issued a report stating that advisors are just as likely as their clients to chase performance instead of taking a disciplined approach through asset allocation.

The authors stated that “the market for financial advice does not serve to debias clients, but actually exaggerates biases that are in the adviser’s financial interest while leaning against those that do not generate fees.”

Yes. Even the professionals can fall into the same mental traps as mom-and-pop investors.

The Problem with Fees and Taxes

Two of the three biggest barriers to beating the market can accelerate if you’re leaving your money outside of your control.

The first: Investor fees.

Hedge funds, for example, have long charged a 2% management fee and a 20% performance fee. So, right off the bat, you’re losing 2% of your money and hoping that the manager outperforms the market so dramatically that he or she can cover those fees on top of the 20% fee based on your gains.

That sounds extremely risky for anyone trying to beat the market. And if your money manager takes your money and puts it into index funds or other assets that have management fees, those costs will also erode any potential gains.

Here’s another place where beating the market is impossible. Let’s say that you or a money manager put money into an exchange-traded fund like the SPDR S&P 500 Trust ETF (SPY).

This ETF attempts to replicate the performance of the S&P 500. But there’s a catch. There is a gross expense ratio of 0.095%. That tiny fee signals that you can’t beat the benchmark outright because the adjusted return minus the fee will be less than the S&P 500’s performance.

In addition, it doesn’t include any commissions or broker fees.

There’s another factor out of your control as well: Taxes. Remember, when you sell any stocks that you’ve held for under 12 months, your gains will be taxed as ordinary income. You don’t lock long-term capital gains until after holding an asset for at least one year.

There’s a third barrier that we’ve discussed in several recent installments of TradeSmith Daily,  which is investor psychology and cognitive bias.

Overcoming Bias to Beat the Market

Yes, you can beat the market. Doing so requires patience, diligent research, and an ability to check your emotions and bias.

As I’ve said before, the individual investor is typically his or her greatest enemy when it comes to the pursuit of gains. As I explained in our series on cognitive bias, investors tend to be more averse to short-term losses, they chase winners, and they try over and over again to time the market.

What’s worse? Investors will tend to gravitate to certain stocks because these companies generate big headlines. Yet, they’ll miss out on an asset like real estate investment trusts (REITs), which have historically provided market-beating total returns due to an appreciation in real estate assets and strong dividends.

According to the National Association of REITs (NAREIT) and Slickcharts, the FTSE Nareit All Equity Reit (Total Annual Return) registered average gains of 13.3% from 2000 to 2020. That figure for the S&P 500 was 7.7%.

Real estate isn’t that exciting. Buildings are boring. But the returns speak for themselves. So, while you might be tempted to buy and sell stocks that are highly touted by Wall Street analysts or television personalities, opportunities exist that don’t generate as much coverage.

It’s not just real estate that can produce market-beating returns. Some of the other strategies that we’ll be discussing in the future have beaten the market more years than not. These include the use of undervalued closed-end funds with strong dividends, deep value investing, small-cap value, and more.

I’ll explain these strategies and assets as we continue to break the common myths of the markets. 

Using these types of active strategies can help you reach your goals faster and limit your risks.

I’ll be talking about another way to improve your odds of success on Monday. Have a wonderful Memorial Day weekend.

How to Boost Gains from Stocks You Already Own – Part One

By: Keith Kaplan

4 years ago | EducationalInvesting Strategies

Today, I want to spend a little bit of time talking about ways to earn more money from your existing stock portfolio.

I know that when it comes to basic leverage strategies and actively managing your portfolio, it might be a little intimidating at first.

Being a buy-and-hold investor is a real path to wealth. Just ask the investors who have followed the strategies of Benjamin Graham and Warren Buffett.

But I want to show you a few ways to take your investing to the next level. In the days ahead, I’ll walk you through three straightforward and conservative strategies to increase your gains.

Again, you don’t have to do any of these. But you must understand the potential of each strategy. (If you have questions, please feel free to send me a note, and I’ll answer them next week).

We’ll start today with one of the most conservative and defensive ways to use options, generate income, and limit your downside risk.

Let’s dive in.

Strategy No. 1: Covered Calls

I want to squeeze every dollar that I can out of a long-term position.

Sometimes, dividends just aren’t enough.

One way you can boost your income is to sell call options on stocks that you already own. Here’s a very simple breakdown of how these options work.

Let’s say that you own 100 shares of Daseke Inc. (DSKE). This company engages in flatbed and other trucking transportation in North America.

On Wednesday, the stock traded at $6.85 per share. That means a position of 100 shares is worth $685. The stock doesn’t pay a dividend.

With these 100 shares, you can use options to increase your income potential. You can “write” or sell a call option that gives the buyer the right – but not the obligation – to purchase your shares at a future date (the expiration date) at a price of your choosing.

Before we dig into this trade, let’s just go over a few simple pieces of terminology that are critical to options trading.

I am going to briefly discuss the Nov. 19, 2021, $7.50 call option.

  • Call Option: This option allows a person to purchase 100 shares for every call contract they own. The strike price and expiration date define the contract (see below).
  • Strike Price: The strike price is the price at which the options contract can be exercised. In the example today, the strike price would be $7.50. Since we are working with a call option, the stock would need to trade at $7.50 or higher for the buyer of the call option to exercise it.
  • Expiration Date: This is the date that the options contract expires. The stock would need to trade at or above $7.50 by the expiration date. If the stock trades at or above that level, the buyer of the call option can exercise it at any time. However, if the price doesn’t reach that strike price by the expiration date, this contract will expire worthless. In that case, the seller of the agreement (you, in our example) would keep the premium and all of their shares.
  • Premium: This is the amount of money that the options seller receives from the buyer for the right – but not the obligation – to exercise that contract in the future. The premium is very important because it can provide the seller with additional upside to their position. On Wednesday of this week, the Nov. 19, 2021, $7.50 call option traded for $1.00.

You could sell this call option on your 100 DSKE shares.

You will receive $1 in premium for every share you own (remember, an options contract allows the buying and selling of 100 shares per contract).

Since a contract is 100 shares, you put $100 in your pocket today.

If the stock rises above $7.50 before Nov. 19, the person who buys the call option from you will have the right, but not the obligation, to exercise the contract and secure your 100 shares on or before the expiration date.

Now, why is that $1.00 premium important?

Because even if the buyer of the contract exercises the contract, you get to keep that premium and pocket the additional gains from today’s stock price.

Let’s say, hypothetically, that the stock goes to $8.50 by November and the call buyer executes the contract. You’ll sell the stock for $7.50, but you’ll have made gains in two ways.

  • First, you’ll have earned gains from $6.85 to the strike price of $7.50  by selling your shares. That’s $0.65 per share – or $65 total. At $7.50, you will be selling the stock, so your gains here cap at the strike price.
  • You’ll also get the additional $1.00 in premium for each of the 100 shares in the contract. That’s $100 in gains per contract.

At that point, you’ve made $1.65 per share – or more than 24% in the 177 days between now and the expiration date. Remember, a covered call “covers” your existing position.

What If the Stock Goes to $10.00?

OK. I know what you’re thinking.

What happens if the stock surges to $10, $20, or $25 in the next few months?

The VQ for this stock is 63%, which means that the stock could rise sharply. Just one VQ deviation would put the stock at $11.17. So, there is a chance this could happen. Let’s talk about this situation.

You could buy back the option that you sold and close that position at a loss. But this is not recommended.

Remember, you are obligated to sell your stock at $7.50 if you write this call option contract. (The only exception is that you can buy the same contract on the market to close your position. If you buy back the same contract with the same strike price and expiration date, you don’t have to sell your stock.)  

If the stock rallies, you don’t lose anything. Yes, the person who buys the contract would get to pocket the difference between $7.50 and whatever the price hits on or before the strike date.

But remember – you would have locked in a more than 24% gain if and when the stock reaches $8.50 (remember, you get to keep that $1.00 premium on top of the stock that you’re selling for $7.50 per share). This is your maximum return should the stock continue to rally. But you can’t lose any money in this scenario.

But you could lose money if you sell “naked” calls on the stock.

This means you sell the call option and don’t already own the underlying stock. In this case, you would need to either buy the stock and deliver it or you’ll need to buy back the same contract you have sold. If that stock goes above $8.50 and you have sold a naked call, you will start to lose money.

Comparatively, the covered call is the more conservative strategy that caps your upside to the value of the premium plus the strike price. I don’t know about you, but I’ll gladly take a 24% return on investment, especially in as little as six months.

But, there’s another reason to trade covered calls.

Here’s the Other Benefit

Now, let’s revisit Daseke’s stock.

In my scenario, you buy 100 shares at $6.85 each.

Your position is worth a total of $685.

Let’s say that you sell that same contract.

You get $100 selling a single Nov. 19, 2021, $7.50 call option.

The stock is trading at $6.85 today.

But let’s say that things go sideways for the stock.

Perhaps the stock falls to $6.25 over the next two months.

Well, that $1.00 in premium that you sold can act as a form of protection.

You’ve now protected your stock to the downside at $5.85.

That’s $6.85 minus the $1.00 premium for every share. So, even if the stock drops to $6.00 come Nov. 19, 2021 – the date of the contract’s expiration – you will still have a slight gain in your total position.

Covered calls provide an upside potential toward a specific target to exit in a predetermined time frame. They also offer protection as a hedge in the event that your stocks decline.

This is a very conservative strategy that can be a “win-win” for investors. I’ll talk more about other strategies next week.

Debunking Market Myths – ‘Cash Is Safer than Stocks’

By: Keith Kaplan

4 years ago | Educational

There’s a lot of misinformation out there.

Time and time again, I find myself on blogs or reading Twitter…

And I constantly stumble across a wealth of stock market myths.

This week, I’m busting several of the biggest misconceptions about the stock market.

I’ll start with the biggest doozy of them all.

The belief that sitting on cash is SAFER than owning stocks.

There are two critical reasons why this is nonsense.

And, as always, I’ll give you a great, lower-risk stock that you can buy and hold instead of leaving your cash in the bank.

Have You Seen Interest Rates?

The most important reason why cash is not a better asset than owning stocks is based on historical returns. The S&P 500, as an index, has returned an average of 8% annually for the last 30 years.

And in the last 10 years, that figure has hovered around 12%. Now, that doesn’t mean that every investor is going to achieve those returns. But by simply owning shares in the SPDR S&P 500 ETF Trust (SPY), a passive fund that replicates the performance of the S&P 500 index, an investor would have generated similar gains on that position.

You cannot get solid returns without risk.

But you definitely can’t generate big returns when you’re just sitting on a pile of cash. The Federal Reserve’s efforts to keep interest rates low over the last decade have punished anyone who has held their money in a savings account.

I’m taking a look right now at my savings account, where I keep emergency cash.

The annual interest rate is a pitiful 0.05%.

That’s right. It’s less than a tenth of a percent…

Even if you’re the most conservative investor in the world who can’t tolerate market volatility, some funds and stocks will give you much higher returns than what you’d get from your local bank.

For example, blue-chip stocks can provide strong dividends – typically between 2.5% and 5% – and give you strong appreciation upside over the long term.

These companies typically have a strong reputation, a strong balance sheet, and market capitalization in the billions. As a result, they tend to generate investment from large institutions that put their confidence in these stocks over the long term.

The “I” Word Evaporates Your Purchasing Power

Want to know the real danger of sitting in cash?

It’s the dreaded “I” word.

Inflation.

The Federal Reserve has said it will allow this economy to run hot and that it wants inflation to be higher. The Fed sets an annual target of 2% inflation. However, in April, the Consumer Price Index (CPI) increased by a staggering 4.2% year-over-year. And the Producers’ Price Index (PPI) increased by 6.2%. 

You’ve probably noticed that the price of just about everything has been going up.

The government has largely blamed gasoline prices, which jumped by 22.5% over the 12 months ending March 30. But supply chain disruptions and pent-up consumer demand have just about everything going higher in prices.

It’s not just the price of gasoline that is rising. Used car prices increased by more than 8% year over year. Take a walk down the lumber aisle at Home Depot, and you might be paying double what you would have paid last year for wood.

And don’t even get me started on the price of a cookout heading into Memorial Day weekend. Bloomberg recently reported, “Food inflation has been inching up for months, driven by soaring commodity costs, costlier transportation, and challenges securing labor.”

Those delicious steaks I want to cook continue to surge in price. Butchers divide cattle into different types of cuts and then sell the meat as boxed beef. These cuts include chuck, rib, loin, sirloin, and brisket. Roughly 86% of all beef falls into one of two categories: Select or Choice. The wholesale price of 100 pounds of USDA’S Choice beef jumped above $300 per hundredweight (CWT).

That figure represents a $75 or 33% increase compared to the same period last year. Ouch.

We don’t even have to look at recent events to understand the erosion of the U.S. dollar’s purchasing power over time. Since 2011, the purchasing power of the U.S. dollar has fallen by 15.8%, according to usinflationcalculator.com.

That means an item that cost $100 today would have cost $84.23 just 10 years ago.

I want to stress that it’s very important to think about investments on a time horizon.

Yes, you could look at what happened in March 2020 and see that the sharp downturn pummeled many investment portfolios. But look at what has happened in the market from March 2020 to March 2021.

The markets surged.

Go even further with this analysis. Yes, in 2008-09, you might have seen the U.S. markets crash and hit their bottom.

But look about what happened over the next 10 years (March 2008 to March 2018).

The reality is that the longer the time horizon, the safer it is to own stocks and the riskier it is to hold cash.

The ongoing war against savers by the Federal Reserve combined with inflation has pummeled the value of the dollar.

Now, with the price of everything going higher and higher, it’s clear that the dollar could be worth several percentage points less at this time next year.

And keep in mind. The numbers that you get from the government on inflation are their “official” numbers. I think it’s fair to say that we are seeing much higher prices than what they’re telling us.

So What Can We Do?

I get it. The markets are sitting near all-time highs. Valuation levels are sitting at the frothiest points since the dot-com crisis. But sitting in cash at a time when the Federal Reserve is intentionally trying to run inflation higher is a real danger.

Rather than park your money in a low-interest savings account, you can put your capital into stocks that will perform well in any market. Consider “defensive” industries like consumer goods, utility companies, and even cybersecurity.

“Defensive” stocks sell products or services that are essential to humanity and can kick off higher yields and returns than cash. Their products remain popular and in-demand regardless of the market’s current state.

Looking for an example? Try Procter & Gamble (PG).

Procter & Gamble pays a 2.5% dividend and recovered quickly during the March 2020 crisis. The company produces toilet paper, dishwashing liquid, soap, hair products, cough and cold products, Pepto-Bismol, mouthwash, and many other household products. (It’s also a major manufacturer of diapers, a product that is constantly in demand.)

Right now, PG stock sits in the Green Zone on TradeSmith Finance. And even though it’s in a side-trend, the company falls into a variety of different strategies on the platform.

These include Dividend Growers, Best of the Billionaires, and Sector Selects. This is also a holding of big-time investors like Ray Dalio, Warren Buffett, and Charles Schwab.

Seeing the stock fit in those buckets helps increase our conviction.

And, instead of parking cash in a bank account, we can tap into the potential of both income and appreciation upside from this dividend stock. I’ll be back on Friday with another myth that requires busting.

Here’s a Different Way to Value Stocks and Find Great Buys

By: Keith Kaplan

4 years ago | EducationalInvesting Strategies

Cash…

You know who has a lot of it?

Corporations like Berkshire Hathaway (BRK.A) and Apple (AAPL) have GOBS of cash.

Institutional investors like private equity firms had $3.1 trillion in “dry powder” in February 2021.

The Federal Reserve’s efforts to boost the economy have fueled a trickle-up effect.

The trillions in stimulus money have cycled into the cash column on the balance sheet of Corporate America. It doesn’t take long. And now, there’s chatter about the best way that a company can return all that cash to its shareholders. 

Corporations can return this money to their investors in a number of ways. They can increase their dividend and return that money on a quarterly basis over time or in the form of a one-time special dividend paid at their discretion.

They can do it even faster by buying back their own stock. Buybacks reduce the number of outstanding shares available and in turn increase the value of shares sitting in their investors’ accounts.

There’s another way they can return money in the form of value: through mergers and acquisitions. Companies can buy out smaller rivals or strategically aligned companies, boost the enterprise value of their firms, and create new business lines and synergies that return larger gains over the long term.

But how does one even know where to start when looking for target companies?

Not only do I have that answer, but I’ve also identified the types of companies that are attractive right now.

Let’s dig in.

Buybacks Versus Buy Ups

This year, companies are awash in cash.

This massive hoard across Corporate America has Goldman Sachs predicting a busy year for stock purchases. The investment bank predicts that stock buybacks will increase by 30% in 2021. The bank expects another 5% increase next year.

This story generated a lot of headlines on CNBC and other sites. The stories of Berkshire Hathaway, Apple, AMD, DuPont, and more fueled a lot of optimism.

But buybacks only offer a short-term boost to the stock.

Where is the real opportunity for the company to grow instead of manipulating its balance sheet for short-term gains?

Mergers and acquisitions deliver real value over time when done the right way. A solid merger can provide long-term sustainability and new profit avenues. Of course, the COVID-19 pandemic set the brakes on deal-making in 2020.

According to a study by WilmerHale, the number of M&A deals around the globe fell from 48,613 deals in 2019 to 45,507 in 2020 (a 6% decline). The same study said that total M&A deal value declined from $3.35 trillion to $2.83 trillion (a 15% drop).

Finally, the average deal size dropped from $68.9 million in 2019 to $62.3 million last year (nearly a 10% drop), according to the same study.

However, the negative trend has reversed. Deal-making has been fast and furious over the start of 2021. Refinitiv says that an all-time record for M&A transpired over the first four months of the year. The company says that total deal-making reached $1.77 trillion through April. That’s a 124% increase year-over-year and represents a 10% increase compared to the all-time record for that period. 

With this amount of buying already underway, we can start to look for companies that might be attractive takeover targets – OR companies that activist investors might target to squeeze greater value out of the firm (and position it to sell to the highest bidder).

Let’s look at a simple metric that shows us which companies might be cheap targets.

Why Enterprise Value to EBIT

We want to look at a very specific formula to give us an ability to judge different companies from different sectors with different tax structures on a 1-to-1 level.

We start our research with a company’s enterprise value divided by its earnings before interest and taxes (EBIT). Let’s break down each of these numbers in the ratio.

A lot of investors tend to migrate to market capitalization to determine a company’s valuation. This metric is measured as the number of shares outstanding multiplied by the share price.

But there’s a better metric to determine the true worth of a company. It’s called enterprise value.

This figure is a measurement of the company’s market capitalization plus its preferred stock plus its debt minus its extra cash.

Here are the four factors we’re looking at to determine enterprise value.

  • Market capitalization is measured by shares outstanding times the current stock price
  • A company’s preferred stock total is the calculation of all preferred stock on the balance sheet
  • A company’s balance-sheet debt is the addition of its long-term and short-term debt
  • A company’s excess cash is all of the cash on its balance sheet minus the difference between the following equation: Current liabilities minus current assets

Next, We Look at EBIT

Our next measure is EBIT or “Earnings Before Interest and Taxes.”

Typically, you’ll find people using EBITDA, which adds in Depreciation and Amortization (which are tied to tax policies).

We aren’t using EBITDA because different companies have different tax structures.

By using EBIT, we can compare companies from different industries.

Once we have the EBIT, we’ll do a simple calculation. We can look at Enterprise Value divided by EBIT. This gives us a very important figure.

It tells us the company’s worth divided by its capacity to create profits. So a lower figure implies that the company can generate greater profits in relation to its total worth, making it an attractive target for other organizations.

An EV-to-EBIT ratio under 8 signals that the stock is trading at a very cheap level. So, let’s take a look at a few companies that fit the bill.

Three M&A Watch List Additions

Within TradeSmith Finance, our signals tell investors when to buy, when to wait, and when to avoid a stock. In all three scenarios, however, no signal should deter you from adding a stock to your watch list.

Today, we want to highlight three companies that deserve your attention based on their low EV-to-EBIT multiple. We’re also looking for companies that are fairly valued and have strong balance sheets based on their Piotroski F Score. (The F-Score is a nine-point measurement that tells investors the strength of a company’s balance sheet. The higher the score, the better the company’s underlying fundamentals are.

Let’s take a quick look at these new watch list additions.

  1. Green Zone: Lousiana-Pacific Corp. (LPX) a leading provider of building products in North America. Founded in 1972 and headquartered in Nashville, Tennessee, the company is operating 25 plants across the U.S., Canada, Chile, and Brazil. Want to know why building supplies continue to go higher? Because this company has successfully been able to pass on higher prices to its customers (large homebuilders.) And as it continues to raise prices, increase stock buybacks, and hike its dividend, the stock continues to trade at very low buyout multiples. The stock’s EV-to-EBIT sits at just 6.32. The stock is in the Green Zone and remains in an uptrend. Wall Street has a consensus price target of $78.40, which represents an upside of roughly 20.3% from last Friday’s closing price. RBC Capital, meanwhile, just rated the stock a Buy and issued a price target of $100. That figure represents a potential upside of 53.5%.
  • Yellow Zone: Nautilus (NLS) is a global manufacturer of fitness equipment. Its brands include Bowflex, Schwinn Fitness, and Modern Movement. The company was very successful during the COVID-19 crisis, as more Americans and Canadians turned to at-home gym equipment to stay in shape. With the economy reopening, shares have plunged over the last four months. Shares are off from 52-week highs of $31.38 to roughly $17.50 per share. That said, the company’s financial strength remains very strong, and it has a very low debt-to-equity ratio of just 0.19. With an EV-to-EBIT of just 4.07 and a P/E ratio of 6.52, the stock’s valuation is very low. We’re going to watch this company. If Nautilus starts to get a little momentum and enters our Green Zone, we might want to pick up shares. It could become a very attractive takeover target of a private equity firm or larger competitor that wants to consolidate brands and take on new customers. Even without a deal, Wall Street has a consensus price target of $21 for the stock. NLS is sitting in the Yellow Zone at the moment, it remains in a side trend, and risk remains sky-high based on the VQ of more than 70%. Let this stock decide which direction it wants to go, and act accordingly. If it reenters the Green Zone, it can be an attractive buy. But if it continues to fade, be sure to wait for the right signal before you make a move.
  • Red Zone: Lakeland Industries (LAKE) is the final company on the list. It should be on your watch list for the months ahead. One of the biggest success stories of the COVID-19 crisis was Lakeland Industries, a global manufacturer of protective clothing and apparel. Shares climbed from under $11 in January 2020 to as high as $47.95 per share in late February 2021. Since hitting those highs, shares have pulled back sharply. The reopening of the economy has dramatically reduced demand. And forward earnings are not expected to match the sales performance of 2020. However, the company’s boom year helped it clean up its balance sheet and make it an intriguing play as it experiences increased demand from industrial customers that are returning to business. The stock is in the Red Zone at the moment, meaning that investors are advised to let the stock find its bottom and wait for it to reenter the Green Zone. That said, it did recently receive price targets of $35 and $45 per share. Shares are currently trading at an EV-to-EBIT ratio of 3.47. The company may see a dip in earnings with the rebound, but we can continue to watch the stock in the months ahead.

The EV-to-EBIT ratio gives us a strong understanding of a company’s ability to generate earnings compared to the total worth of the company. It also allows us to compare stocks across various industries.

You can add the three stocks above to your watch list or do some additional research. Just be sure to add your watch list within TradeSmith Finance to get a stronger read on buy signals and to bolster your conviction. In the list above, you have a Green Zone buy and two additional stocks to monitor in the months ahead.

I’ll be back tomorrow with additional insight on how to identify winning stocks.