Featured

A Travel Crisis Grows as We Approach a Hectic Holiday Season

By: Keith Kaplan

4 years ago | News

Many Americans are looking forward to traveling for the holidays to see family and friends, after lockdowns and COVID-19 waves hindered their plans last year. But the airline industry is facing a new problem. The current labor shortage could create another set of challenges for an industry in need of recovery.

Many Americans are looking forward to traveling for the holidays to see family and friends, after lockdowns and COVID-19 waves hindered their plans last year. But the airline industry is facing a new problem. The current labor shortage could create another set of challenges for an industry in need of recovery.

Read Full Article Array
Featured

The Last-Mile Trend is The First Way to Profit After COVID-19

By: Keith Kaplan

4 years ago | News

I spoke about a few of the changes COVID-19 is bringing, such as the shift to working and living remotely and the economic consequences. Today, let’s look deeper at another one of these trends: the future of delivery.

Read Full Article Array
Featured

The 21st-Century Pearl Harbor Moment

By: Keith Kaplan

4 years ago | Investing StrategiesNews

Today, many of us already think of the COVID-19 pandemic as another tragedy that “will live in infamy.” And while the pandemic and Pearl Harbor are very different in many ways, one thing is clear. Historians will look back at both as the beginning of considerable changes to our society and economy.

Read Full Article Array
Featured

So This Is Tesla’s Secret Weapon?

By: Keith Kaplan

4 years ago | News

Today, I want to highlight a few advancements in Tesla’s battery storage business and explain why Tesla is quickly maturing into more than just a car company.

Read Full Article Array
Featured

Another Warning Sign in The Market?

By: Keith Kaplan

4 years ago | EducationalNews

The central bank is poised to start the processing of tapering its balance sheet. However, the market doesn’t seem to be reacting negatively to the news. But I want to highlight yet another warning sign flashing red for the market. Let’s talk about the Fed, and then highlight this “alternative” signal for investors.

Read Full Article Array
Featured

Don’t Get Mad… And Don’t Get Even

By: Keith Kaplan

4 years ago | EducationalInvesting Strategies

This market has been sideways for several months. And this one rule will help you better manage your money.

Read Full Article Array
Featured

What to Make of the Cannabis Bear Market

By: Keith Kaplan

4 years ago | News

If you’re a buyer and holder of cannabis stocks in recent months, you need to read what’s happening in this industry.

Read Full Article Array
Featured

Rule One: Don’t Do This When It Comes to Owning Stocks

By: Keith Kaplan

4 years ago | EducationalInvesting Strategies

When it comes to buying and owning stocks, there is one rule you must follow: Don’t fall in love with the companies you buy. They won’t love you back.

Read Full Article Array
Featured

From Bad to Worse: Alibaba’s Future Looks Uncertain

By: Keith Kaplan

4 years ago | News

If this is a stock in your portfolio, you need to read the cold hard truth that I’m about to tell you. And if analysts are trying to convince you that now is the time to buy Alibaba… you also need to read this. It’s not time to touch this stock yet. Here’s why.

Read Full Article Array
Featured

​​This ‘Liquor Store’ is the Next Great COVID-19 Trade

By: Keith Kaplan

4 years ago | EducationalInvesting Strategies

In 2016, a company you don’t associate with alcohol generated $1 billion in booze sales. Why am I pointing this out? Because this random fact drew my attention to a real buying opportunity.

Read Full Article Array
Featured

A Warning From Warren Buffett: We’re a Long Way From 1981

By: Justice Clark Litle

4 years ago | Investing Strategies

The Berkshire Hathaway annual letter — penned, as always, by CEO Warren Buffett, now 90 years old — came out this past weekend. If you haven’t read it yet, you can do so here. Reading the Berkshire letter, and hunting for easter eggs of Buffett bon mots and insights, has become a kind of annual tradition for much of the…

Read Full Article Array
Featured

The New York AG Issues Tether a Speeding Ticket

By: Justice Clark Litle

4 years ago | News

On Feb. 5 we asked the following question: “Has Bitcoin (and the Entire Crypto Space) Been Boobytrapped by Tether?” Our answer was “no,” and you can read why here. The short version is that Tether, a popular U.S. dollar stablecoin, is probably not a systemic risk. An elegant analysis from someone named “Crypto Anonymous” had argued otherwise, claiming that Tether…

Read Full Article Array
Featured

Crash Risk Rising: Here’s What Could Cause a ‘Market Structure’ Meltdown Event

By: Justice Clark Litle

4 years ago | Investing Strategies

The sell-off at the long end of the U.S. bond market is turning into a global bond market rout. Yields are rising in countries around the world; in places where nominal long-end yields were negative, like Germany and Japan, they are flipping positive. To put it more simply, as U.S. Treasury 10-year notes and 30-year bonds plummet in value, their…

Read Full Article Array
Featured

Inflation Alarmists are Panicking Far Too Early

By: Justice Clark Litle

4 years ago | Investing Strategies

Investors are starting to worry about inflation. Some are even sounding alarms of potential hyperinflation, throwing around references to Weimar Germany and Zimbabwe. This is quite a shift in stance. For quite a long time, Wall Street behaved as if inflation had been banished forever. Now there are fears, implied if not spoken aloud, that inflation is just around the…

Read Full Article Array
Featured

The EV Bull Market is Over

By: Justice Clark Litle

4 years ago | News

“Because I used to love her,” the Rolling Stones sang, “but it’s all over now.” The electric vehicle (EV) bull market is officially over, too. The EV bull market — which some would call a bubble, or even a mania — has shuffled off its mortal coil. It is neither resting nor pining for the fjords; it is now an…

Read Full Article Array
Featured

Speculative High Flyers are Rapidly Losing Altitude

By: Justice Clark Litle

4 years ago | News

On Friday of last week we said: “There is a formidable bearish case for overvalued technology stocks moving forward, and it is only getting stronger by the day. “The bear case has to do with interest rates at the long end of the curve, and the willingness of the Federal Reserve to sit back as long-end yields (the 10-year and…

Read Full Article Array
Featured

Because of Texas, a Historic Infrastructure Bill Now Looks Inevitable

By: Justice Clark Litle

4 years ago | News

Imagine the world as a ball-shaped scoop of ice cream, sitting upright in an ice cream cone. The polar vortex is a circular flow of low-pressure cold air swirling around the top, or dome, of the ice cream scoop. This low-pressure air flow is held in place by a ring of high-pressure warm air that surrounds it like a doughnut. …

Read Full Article Array
Featured

A Big Reason to be Wary of Big Tech

By: Justice Clark Litle

4 years ago | Investing Strategies

“The only reason to be bearish… is there is no reason to be bearish.” That is the view of Michael Hartnett, Bank of America’s Chief Investment Strategist, as recently expressed in a note to clients. In our view, there are reasons to be bearish. It just depends which assets one is looking at, and the nature of the bear case…

Read Full Article Array
Featured

Crude Has Some Good Years Left (the Oil Age isn’t Over Yet)

By: Justice Clark Litle

4 years ago | Educational

“The stone age did not end because the world ran out of stones, and the oil age will not end because we run out of oil.” The Economist attributed that pithy statement to Don Huberts, the head of Shell Hydrogen, in 1999. According to New York Times columnist Tom Friedman, it was first said by Sheikh Ahmed Zaki Yamani, Saudi…

Read Full Article Array
Featured

America is Winning the Vaccine Race

By: Justice Clark Litle

4 years ago | Educational

America looks poised to come from behind, muster its formidable might, and win hands down — just as it has done before, time and time again, in various contests throughout the twentieth century. But this time it isn’t about a World War, a space race, or an arms race; it’s about the vaccine rollout. America winning the vaccine race likely…

Read Full Article Array
Next Page » « Previous Page

A Warning From Warren Buffett: We’re a Long Way From 1981

By: Justice Clark Litle

4 years ago | Investing Strategies

The Berkshire Hathaway annual letter — penned, as always, by CEO Warren Buffett, now 90 years old — came out this past weekend. If you haven’t read it yet, you can do so here.

Reading the Berkshire letter, and hunting for easter eggs of Buffett bon mots and insights, has become a kind of annual tradition for much of the financial world. Analysts, money managers, journalists, and investors of all stripes tend to read it the weekend it comes out, even if they own no shares.

Your editor is one such reader: Though never a shareholder, we’ve been perusing the Buffett letters for nearly 20 years. We also have all of the old letters on file, dating back long before we were born. The best one of all, in our view, is the Buffett Partnership letter covering 1965, available here.

The 2021 letter felt somber and restrained compared to past years. This makes sense, given what America and the world had to go through in 2020.

Still, in terms of pessimism and dark warnings — far from the normal fare for Buffett — this passage on the “bleak future” for fixed-income investors stood out:

[B]onds are not the place to be these days. Can you believe that the income recently available from a 10-year U.S. Treasury bond – the yield was 0.93% at year end – had fallen 94% from the 15.8% yield available in September 1981? In certain large and important countries, such as Germany and Japan, investors earn a negative return on trillions of dollars of sovereign debt. Fixed-income investors worldwide – whether pension funds, insurance companies or retirees – face a bleak future.

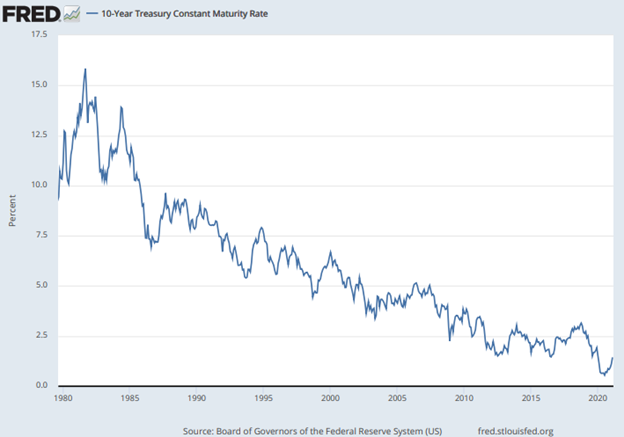
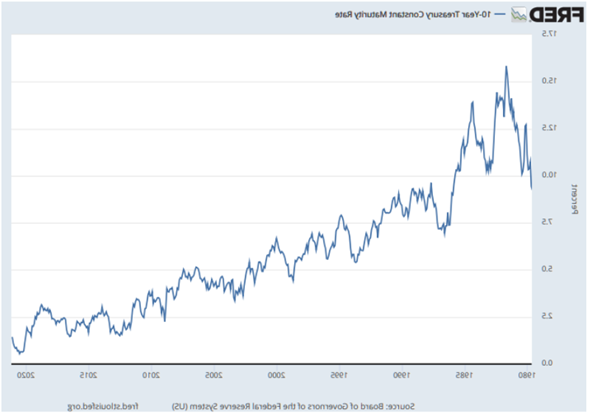
Per Buffett’s calculation, over the course of almost four decades — from September 1981 to year-end 2020 — the yield on the 10-year note fell by 94%.

In regard to falling yields, here is another remarkable stat per Chris Bloomstran, the president and chief investment officer of Semper Augustus: As of Feb. 27, the price of the U.S. 30-year Treasury bond had fallen by more than 16% in three months — a drop that erased 10 full years’ worth of coupon payments. Also per Bloomstran, the 10-year gave up 7 years’ worth of coupons in that time.

Imagine clipping coupons on your government bonds for a full decade — then taking a hit on the principal worth all of the payments and then some, over the course of just 12 weeks. Now imagine trying to be a government bond investor moving forward.

For holders of long-dated U.S. Treasuries, the pain is increasing because the U.S. economy is reflating, powered by vaccine optimism, pent-up demand, and a tsunami of fiscal stimulus. Economic growth of the rip-roaring variety is coming, with inflation to follow on the heels of that.

If you’ll pardon the cheap rhyme, the interest-rate mantra “lower for longer” now looks “wrong and wronger.” Per data from Bespoke Investment Group, the 2021 sell-off in the Merrill Lynch 10+ Year Treasury Index has already produced the third-worst percentage since records began in 1988 — and the year is still young.

Then, too, Buffett’s harkening back to 1981, and a 94% decline in yields over nearly 40 years, is a sobering reminder of how far the pendulum has swung. The chart below, via FRED, shows the four-decade journey of the 10-year yield from 1980 to today.

It is hard to beat the 10-year yield for a vivid illustration of what Ray Dalio calls “the long-term debt cycle.”

The Long-Term Debt Cycle is the cyclical pattern by which interest rates and inflation pressures tend to fall, even as debt and leverage levels rise, for decades at a time.

At the beginning of the long-term debt cycle — which had its genesis in 1981 — inflation was sky-high, while debt and leverage levels were low.

Interest rates peaked in 1981 because that was the year Paul Volcker, Chairman of the Federal Reserve, finally “broke the back of inflation” in a way investors could acknowledge.

Volcker’s efforts to kill off inflation, through a multi-year period of painfully high interest rates, were part of what cleaned out the debt and the leverage. The United States went through not one, but two recessions in the early 1980s, spaced about 14 months apart, as the price of borrowing went through the roof.

But Volker’s successful anti-inflation campaign, coupled with low debt-and-leverage levels, was the very thing that allowed a new long-term debt cycle to kick off.

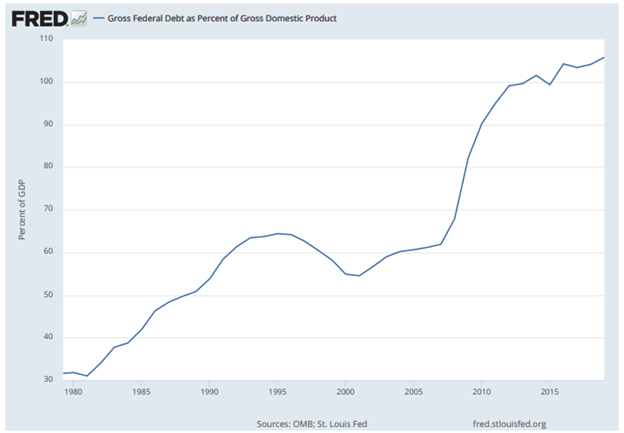
The build-up of debt to GDP from 1980 onward, as shown in the FRED chart below, is a sort of inverted image of the falling 10-year yield. That is because, in a standard long-term debt cycle, debt levels go up as inflation and borrowing costs go down.

The “bleak future” that Buffett warned of for fixed income investors relates to what happens when the long-term debt cycle reaches its farthest point.

Think of a giant, slow-moving pendulum that swings in the same direction over a 40-plus-year period. Over that entire window of time, bond yields and inflation pressures are falling, even as debt and leverage levels rise.

Once the pendulum starts to swing the other way, a multi-decade trend in the opposite direction occurs. Instead of falling for decades on end, yields go into a pattern of rising for decades on end (which means bond prices fall); and instead of debt and leverage building up to ever-higher levels as a percentage of output over time, there is a far less pleasant multi-decade period where debt and leverage levels are cut back (or inflated away) to a lesser percentage of output over time, rolling back the previous extreme.

Then, once the pendulum has swung all the way back, it swings forward yet again, a kind of permanent oscillation between high interest rates versus low, coupled with low debt levels versus high. And because a nation’s economy is immortal — assuming the nation continues to exist — these generational patterns of build-up and roll-back can repeat ad infinitum.

What a majority of investors haven’t yet realized is that their entire personal experience in markets — going all the way back to 1981 — is geared toward the pleasant half of the long-term debt cycle.

All that they know on a gut-feel basis — unless they were active market participants in the 1970s — is that left-to-right pendulum swing where interest rates fall, as debt and leverage rise and rise.

Buffett’s warning to fixed-income investors is a reminder we are headed for the less-pleasant half of the long-term debt cycle — the multi-decade period where interest rates rise and rise, and then rise some more, as governments, corporations, and consumers either actively reduce their debt loads or see the value of those debts inflated away.

Then, too, inflation is a part of the process because the debt adjustment almost always happens more via inflation than hardcore belt-tightening: It is just easier to reduce the debt load via printing press, which reduces the percentage ratio of debt-to-output over time. That tendency also explains why inflation will likely roar higher again — with interest rates rising up with it — over the next decade or two (or three, or four).  

Just for fun, we took the 10-year yield chart and flipped the image horizontally (below), to create a visual picture of how the next 40 years might look if the long-term debt cycle retraced its steps perfectly. It’s never that simple, of course, but as a mental exercise, it’s worthwhile trying to imagine interest rates following a path like the one below.

The bottom line is that very few investors are ready for the world that is coming.

With “lower for longer” becoming “wrong and wronger” as the U.S. prepares for emerging-market-like levels of growth in the year ahead — and the Federal Reserve signaling it is fine with a jump in long-term yields, at least for now — dislocations in vulnerable areas of the stock market are likely just beginning.


The New York AG Issues Tether a Speeding Ticket

By: Justice Clark Litle

4 years ago | News

On Feb. 5 we asked the following question: “Has Bitcoin (and the Entire Crypto Space) Been Boobytrapped by Tether?”

Our answer was “no,” and you can read why here.

The short version is that Tether, a popular U.S. dollar stablecoin, is probably not a systemic risk.

An elegant analysis from someone named “Crypto Anonymous” had argued otherwise, claiming that Tether was essentially a giant counterfeiting scheme that could blow up at any moment.

The “Crypto Anonymous” view naturally generated significant levels of fear and concern, as Tether stablecoins generate roughly $100 billion per day in trading volume and play a meaningful role in the crypto ecosystem.

We pushed back on those concerns, doubting the assertion that Tether is a brazen counterfeiting scheme with some of the largest crypto exchanges in the world being in on the con.

Last week, on Feb. 23, the Tether-as-fraud question took a significant step toward resolution, allowing many worried crypto investors to breathe a sigh of relief.

The important news was the announcement of a settlement between Bitfinex, the crypto exchange that runs Tether, and the New York Attorney General’s office. Letitia James, the New York AG, had opened an investigation into Bitfinex nearly two years ago, in April 2019.

The settlement means Bitfinex and Tether will pay a fine of $18.5 million — an amount considered by observers to be a “speeding ticket” relative to the sums involved — with no admission of wrongdoing.

In addition to the $18.5 million, Bitfinex will also cease all trading activities for New York state residents and provide New York authorities with quarterly financial reports on the state of Tether’s dollar reserves for the next two years.

The settlement was a major win for Bitfinex, for Tether, and for crypto on the whole. In word, the New York AG’s office rained fire and brimstone on Tether; but in actual deed — the $18.5 million settlement — not much was done at all.

There are still plenty of things not to like about Tether. Certain aspects of the Bitfinex operation continue to be questionable, and the reason the New York AG investigated in the first place is enough to raise eyebrows.

In 2017, it appears Bitfinex lost the eye-bulging sum of $850 million when Crypto Capital Corp., a Panamanian firm Bitfinex had entrusted $1 billion in capital to, either blew up or saw its founders run an “exit scam” (the crypto-world term for when founders take the money and run).

In order to stay afloat, it then appears Bitfinex had at least $625 million worth of Tether reserves transferred to its own accounts, to cover the gaping hole created by the implosion of Crypto Capital Corp. (Bitfinex is still trying to recover the lost $850 million, though whether it will is anyone’s guess.) 

Fast forward to 2021, and the New York AG has apparently found Bitfinex and Tether to have behaved in an awful way in 2017 — but not to be perpetrating a present-day fraud.

The commitment to provide quarterly financial statements for two years is a key aspect of the Tether settlement. In addition to the New York AG wrapping things up with a fine, a forced measure of accounting transparency helped many crypto community worriers to conclude that, in spite of the lingering questions, Tether is probably okay.

For whatever reason, Tether is wildly popular in Asia, primarily as a liquidity source for moving funds into and out of other coins. We maintain the view that, were Tether to lose popularity, another U.S. dollar stablecoin — like USDC, which has a market cap of $8.8 billion — could easily take its place.

In terms of systemic risk, the key question is whether or not Tether is being used to artificially inflate the value of Bitcoin. For that to be happening, Tether would have to be an active and deliberate counterfeiting operation, with willful agents deliberately creating unbacked Tethers on a routine basis.

If that isn’t happening, though — if the Tether supply is legitimate — then the extremely high volume shown by Tether (around $100 billion per day) is probably a function of the Matthew Effect: To those who have, more will be given. The more popular a liquidity provision tool becomes, the more that other users will adopt it by default, which increases the liquidity edge even more.

In certain parts of the world, they really like Tether — and the liquidity created by that volume generates a self-reinforcing feedback loop. A key consideration here is the ease with which Tether can be swapped for some other stablecoin, and the many nodal points at which Tether and Bitcoin can be exchanged for fiat currency.

To run an effective Ponzi scheme, you need a closed system with very few points of access; the crypto space is an open system with myriad points of access. This increases our confidence that, while Tether is still sketchy in some respects, it is neither a large-scale counterfeit operation, nor an inflated source of demand, nor a true source of systemic risk for crypto assets.

Were it otherwise, the New York AG likely wouldn’t have concluded its digging with an $18.5 million fine and little more — a sum Wall Street firms would consider a cost of doing business. (In December 2020, Robinhood paid a fine of $65 million; hardly anyone noticed.)


Crash Risk Rising: Here’s What Could Cause a ‘Market Structure’ Meltdown Event

By: Justice Clark Litle

4 years ago | Investing Strategies

The sell-off at the long end of the U.S. bond market is turning into a global bond market rout. Yields are rising in countries around the world; in places where nominal long-end yields were negative, like Germany and Japan, they are flipping positive.

To put it more simply, as U.S. Treasury 10-year notes and 30-year bonds plummet in value, their nominal yields spike higher. That spike is contagious, causing long-end yields everywhere to rise. 

There is serious danger here. The risk of market meltdown — or some kind of flash crash, reminiscent of what happened in March 2020 — is now high.

Events are moving so quickly, in fact, that markets could be in full meltdown mode by the time you read this (though hopefully not).

As a side note, we’ve lost track of how many times the “by the time you read this” qualifier has applied to same-day broadcast in the past year — a function of events unraveling at so great a speed that even a four-to-six-hour publishing window can make a huge difference.

The danger stalking markets now is related to something called a “market structure event.”

A market structure event is major price dislocation — like a meltdown or a flash crash — that happens for reasons unrelated to investor sentiment or a long-term fundamental outlook.

Market structure is a reference to the way investors are positioned: Who is long, who is short, how much leverage they have, and so on.

The phenomenon of “portfolio contagion” is notably a market structure issue: If leveraged hedge funds take a large hit to a certain area of their portfolios, for example, they often have to liquidate positions in unrelated areas of the portfolio to reduce exposure across the board.

In this manner, a sell-off can be contagious in that the selling jumps from one area of the portfolio to another; the linking factor is the structure of what the hedge funds are holding.

Portfolio contagion issues can even impact safe-haven assets to the degree that, in the midst of a meltdown, safe haven assets are like cash in a bank account; investors will sometimes sell a portion of their safe-haven positions to raise cash when everything else is going haywire. This is why, say, the price of gold can fall hard with everything else when a real meltdown hits.

Market structure can also refer to complex, behind-the-scenes arrangements comparable to the plumbing structure of a building. Like office tenants in the building, investors don’t see or think about the pipes, which are hidden in the walls; nor do they worry about boiler maintenance, as it is presumably some maintenance person’s job to take care of that.

But the tenants certainly notice when the pipes start to burst or the boiler explodes: If this happens for some technical behind-the-scenes reason, it is a market structure event (which can also be dubbed a plumbing event).

The most dangerous of all market structure events takes place when there is too much leverage in the system and too many market participants with the potential to become forced sellers.

Some version of this happened in the Crash of 1987, for example, as institutional investors tried to hedge their equity portfolio risk by selling S&P 500 futures as a hedge. The more the market dropped, the more that S&P 500 futures contracts were sold; with everyone doing this at once, and buyers stepping back, this caused a drop for the history books.

The danger posed today, in terms of market structure meltdown risk, comes from three areas: The U.S. treasury market; the liquid and beloved FANG names; and highly speculative, highly illiquid tech sector names, many of which are packaged into ETF products.

Here is a quick summary of the market structure risks posed by each area:

  • The bond market is exposed to “convexity hedge unwinds” related to the mortgage market. We’ll explain in more detail what that means, but the shorthand version is that, as mortgage rates go up, institutional investors holding trillions of dollars’ worth of mortgage-backed securities have incentive to sell U.S. treasuries, causing yields to spike further.
  • The FANG names are the stock market equivalent of high-yielding money market accounts or low-risk zero coupon bonds: Putting a big slug of money in, say, Apple or Google is almost like getting a risk-free return on cash with internal compounding (or that is how investors have acted anyway). The trouble is that, in times of market stress, there is no substitute for actual, honest-to-goodness cash; that in turn means investors could decide to sell FANG shares en masse, not because they have soured on big tech, but because they need liquidity.
  • The low-liquidity, insane-valuation, speculative mania areas of the market — think garbage SPAC offerings and companies whose market cap makes no sense — have the potential to face substantial selling in a “zero bid” situation, meaning, investors desperate to get out could be flooding the market with sell orders, but finding no buyers on the other side. The trouble with Buzz Lightyear-type valuations (“To infinity and beyond!”) is that, when euphoria evaporates, the result can be a Wile E. Coyote-style air pocket due to an absence of buyers all the way down.

In some ways, a speculative mania is like throwing a months-long party entirely funded by credit cards.

The whole thing is a blast; the entertainment is free; nearly everyone is having a great time (and seemingly getting rich); and for most of the mania it feels like the party will never end.

The trouble with a mania, though, is that eventually, the bill always comes due.

The bill itself can come in many different forms: Sometimes, as described here, it is the inevitable consequence of an extreme build-up in market distortions, as expressed through the corrective mechanism of a violent market structure event.

Then, too, what’s going on in the bond market right now has the potential to dislocate far more than just stock prices.

If the U.S. treasury market goes further into a violent sell-off for non-economic reasons — meaning, bond market sellers dumping not because of a fundamental view, but for other reasons entirely, like the unwinding of convexity hedges — that means long-end yields (the nominal interest rate on the 10-year and 30-year) could spike to levels that really and truly start breaking things.

It’s really quite the domino chain, because if a market structure event on the bond side makes yields spike in a violent enough fashion, the Federal Reserve might be forced into another nuclear-level intervention on the scale of March 2020 — a kind of do-or-die yield curve control (YCC) at the long end (we’ll have to dive further into the mechanics of YCC some other day).

Just know that if a forced Fed intervention happens — where the Fed steps up buying at the long end of the bond market — it could mean an additional hundreds of billions of dollars, or even trillions of dollars, instantly added to the Federal Reserve balance sheet, with long-run consequences of who knows what.

Paradoxically, in the near term, this whole danger scenario is wildly bullish for the U.S. dollar, in part because other currencies will look so much worse in the event global financial markets go haywire, and in part because panicked U.S. investors will exit their international holdings and repatriate dollars en masse.

In TradeSmith Decoder we recently took an aggressively bullish U.S. dollar position spread across multiple currencies — even though we are long-term U.S. dollar bearish — and today we are feeling better than ever about that long USD exposure.

Our rationale for getting bullish on the USD was rooted in the Quantum Deficit Effect, as explained in these pages on Feb. 10 — but the dollar looks even better now with risk assets going into convulsions. When things get bad — as in really, really bad — everybody wants cash, which still means dollars (though someday it might not).

Circling back around to the unwinding of convexity hedges: The convexity hedge aspect of the bond market helps explain why U.S. treasuries could sell off much harder from here (which in turn could translate to yields spiking higher, which could then wreak further havoc).

The U.S. bond market has gone into convexity-related meltdown mode before (causing long-end yields to spike) with consequences rippling out across bond markets globally. The most famous example of this is probably the infamous “bond market massacre” of 1994, a rising interest rate period in which a slew of overleveraged hedge funds and shadow bank lenders were carried out on a stretcher.

Like earthquakes that vary in size, serious bond market dislocations furthermore seem to occur like clockwork every few years; we saw one in March 2019, and another one dubbed the “taper tantrum” in May 2013. (Then, too, the 1994 bond market massacre got going in March, which means these things tend to happen in a March-April-May timeframe — uh-oh.)

Convexity hedging — we’ll try to keep this simple — is a popular strategy for investors in the mortgage-backed securities market, which is gigantic (the U.S. has nearly $17 trillion in mortgage debt).

For investors in mortgage-backed securities (MBS), there is something called “prepayment risk,” which happens when homeowners decide to refinance and pay off their old mortgage loan, swapping it out for a new mortgage loan at a lower rate.

Institutional investors aren’t happy to see their MBS holdings close out early, because it typically means they will have to reinvest the previously deployed MBS funds at a lower yield. For these investors, prepayment risk means losing an attractive source of income or swapping it for a less attractive one.

What’s more, MBS prepayment risk is greatest when U.S. treasury prices are rising (and yields falling). That is because falling interest rates create a greater appetite for refinancing on the part of homeowners.

As a result of the relationship between rising treasury bond prices, falling interest rates, and increased payment risk, institutional investors like to “convexity hedge” their MBS holdings by purchasing large quantities of U.S. treasury bonds. The idea is that, if prepayment risk is rising, as an MBS investor, you will at least make money on U.S. treasuries going up.

Now, here is where it all goes haywire: When U.S. treasury prices threaten to decline sharply — the way they are now — interest rates start to rise, and prepayment risk goes away. Homeowners lose a taste for refinancing with rates moving higher; at the same time, institutional investors in mortgage-backed securities no longer have a need to hold large quantities of U.S. treasuries as a convexity hedge.

The upshot is that, as U.S. treasury prices start to fall, and yields start to spike, there is the added risk of a massive “convexity hedge unwind” as large institutional investors in the mortgage-backed securities market dump large quantities of U.S. treasuries they no longer need to hold. 

Again, the “convexity hedge unwind” aspect of bonds is a strange deal — it gets into the plumbing of the nearly $17 trillion mortgage market — but the most important thing to be aware of is that the dynamic we are describing here has violently rocked bond markets before, on multiple occasions.

The worst-case scenario over the coming days and weeks — which, unfortunately, is all too possible — is a scenario in which all three market structure scenarios come to pass and start feeding on each other.

Imagine a scenario where long-end yields continue to spike higher — thanks to convexity hedge unwinding en masse via the mortgage market — even as panicky investors start liquidating their big tech holdings to raise cash, even as highly speculative low-liquidity tech names go “zero bid.”

Not only could this scenario actually unfold, it really wouldn’t be a surprise if it did; that is because, for one, we have seen the movie (or various forms of it) many times before; and for too, the serious, embedded dangers inherent in markets now are a function of reckoning for speculative overreach.

Sometimes the price paid for overreach isn’t paid by a formal bill, but rather the reaping of a whirlwind brought on by a violent market structure event (which never would have happened if not for a reckless degree of speculative excess build-up in the first place).


Inflation Alarmists are Panicking Far Too Early

By: Justice Clark Litle

4 years ago | Investing Strategies

Investors are starting to worry about inflation. Some are even sounding alarms of potential hyperinflation, throwing around references to Weimar Germany and Zimbabwe.

This is quite a shift in stance. For quite a long time, Wall Street behaved as if inflation had been banished forever. Now there are fears, implied if not spoken aloud, that inflation is just around the corner. 

The latest burst of inflation fear has to do with a sell-off in global bond markets. Rates are quickly rising at the long end of the curve. At 2.24%, the 30-year U.S. Treasury yield is back to where it was before the pandemic. Meanwhile, in Germany, the 30-year bund yield — which was negative a year ago — has moved back into positive territory.

We would argue it is the rate of change in long-end yields, more than their absolute level, that has investors mildly freaked out. In the big scheme of things, the 30-year yield is still not that high: Just 24 months ago, it was above 3%. But it is rising fast now, and that could spell trouble.

Yields are rising because the market expects ripping, roaring growth. The United States could see 5% GDP growth in 2021 — the fastest since the 1980s — and the rate could be higher still.

When asked in a question-and-answer session if 2021 growth could be 6% — a respectable pace for any emerging market, let alone a rich country — Jay Powell’s response was, “could be,” meaning yes, the Federal Reserve sees that as possible.

You can tell the market believes in growth by observing intermarket price action — the implied judgements of the market as evidenced by which prices are going up, which ones are not, and how fast the movements are happening.

Energy stocks are rocketing higher, for example. In December 2020, TradeSmith Decoder loaded up on energy stocks to specifically position for the recovery narrative. It is playing out in spades now.

Financials are also powering higher; bank stocks, by some measures, are showing their best performance since 2007. This is a function of the steepening yield curve, and expectation that profitable loan growth is about to surge.

And then you’ve got travel and leisure stocks like airlines, cruise ships, hotel operators — all surging. These are hallmarks of an aggressive recovery narrative.

The thing that isn’t surging — but instead is slumping lower — is gold. The gold price continues to shuffle and slump lower, as it has done for months.

Gold is telling us the alarmist inflation views are wrong — or that they are wrong for the foreseeable future, anyway, which amounts to the same thing.

Over a period of many years, we see strong inflation as almost inevitable. That, in turn, means an inflationary crisis is highly likely. But the key qualifier there is “over a period of many years.” Inflation is not a light switch; rather than flipping on instantly, it can take a long time to build momentum. 

Our concern, for our TradeSmith audience in particular, is that investors will focus on the first-order impacts of money supply growth and fiscal stimulus and assume it is time to buy gold with both hands.

The price action is saying something else, though. It is telling us that growth will come first.

Many are skeptical that government spending can buy economic growth. In the long run, so are we. But in the short run, in conjunction with a coiled-spring economic environment where consumer demand was pent-up anyway, fiscal stimulus can absolutely buy growth — and possibly extend the “growth first, inflation later” narrative over multiple quarters.

In the third quarter of 2020, the world looked quite different — it didn’t have 95% effective COVID-19 vaccines.

Lest we forget, for most of 2020, it wasn’t clear a safe and effective COVID vaccine would be developed in a short period of time, or that it could even be developed at all.

In our view, the absence of a safe and effective COVID vaccine would have brought on inflation much faster.

That is because, if pandemic uncertainties had stretched out interminably — along with the threat of rolling lockdowns, overflowing hospital beds, and so forth — economic growth would remain somewhere between weak and non-existent.

In that counterfactual “no end in sight” environment, heavy fiscal spending would have been tantamount to the U.S. government pushing on a string alongside the Federal Reserve. With the economy still weak, and consumers fearful and exhausted, surplus funds from ever larger helicopter drops would have flowed increasingly into haven assets like gold.

Vaccines changed the game, though. The arrival of astonishingly safe and effective vaccines in November 2020 — along with the feasible possibility of rolling them out quickly — put economic growth back in focus. The vaccines powered an optimistic set of forward expectations, centered around growth, that reverberates to this day.

That is why energy stocks, financial stocks, and travel and leisure stocks are all flying. Real growth, and a real release of pent-up demand, is coming.

To put it another way, this is not a great environment for inflation, because economic growth absorbs inflation. If wages, employment, consumption, and corporate profits are all rising, those factors can enable a sustainable rise in long-term interest rates.

Then, too, the Federal Reserve is logical in wanting to see a period of moderate inflation. If we see inflation run at, say, 3% for a while, that would again allow jobs, spending, and corporate profits to pick up, with workers and companies and banks all making money even as debt burdens were eased (by modest inflation eroding the value of the debt).

Eventually, in our view, a real inflation problem will arise. But for investors worried about inflation — or those who want to invest around inflation expectations — the operative question has to be, how much time will pass before inflation becomes a problem?

Let’s say that the five-year breakeven inflation rate — currently at 2.35% of this writing — hits workable levels of 3%, then 4%, then 5% — and starts becoming a problem at the 5% threshold and above, with the Federal Reserve unable to rein things in.

We can imagine four stages of the coming inflation cycle, like this:

moderate inflation → problematic inflation → severe inflation → crisis-level inflation

The problem for inflation alarmists is that the process of traversing from the first stage (moderate inflation) to the fourth stage (crisis inflation) is likely to take years.

If each of the first three stages last six to 12 months, for example — not an unreasonable estimate — it could be 2023-2024 before crisis inflation arrives. 

Real economic growth can absorb inflation pressure because a rising tide of productivity and profits enables the handling of higher costs. As workers get paid, they can save and spend more; as businesses accrue more profits, they can handle higher financing costs for the purpose of further expansion.

This is why a vaccine-powered recovery is such a negative prospect for inflation-haven assets in the near term. Real growth prospects mean capital can be put to work, which increases confidence in the currency and makes debt burdens easier to shoulder.

If the United States had faced an extended COVID recession in 2021, with no amount of spending able to overcome the harmful impacts of the virus, it would have been a different picture. In an economy rendered lethargic and sick via COVID, adding to the money supply would merely have eroded confidence in the currency, magnifying problems across the board.

Prior to the game-changing vaccine news, America appeared headed down a path of parabolic money supply growth, with economic activity to absorb it.

That pre-vaccine outlook was one of the reasons we wrote about Weimar Germany in September 2020.

The Weimar experience was one where, due to a crushing debt load of World War I reparations, Germany engineered a deliberate policy of double-digit inflation to erode the value of those debts. They ran the printing presses not just hot, but white hot, as a way to survive economically. 

The double-digit inflation plan then got out of control — with hyperinflation kicking in — after France and Belgium decided to occupy the Ruhr in 1923, causing German industrial production to grind to a halt.

So a key thing to understand — especially if one wishes to equate U.S. money supply growth to the Weimar experience — is that even in Weimar Germany, the crisis inflation stage (full-on hyperinflation) took years to play out, and furthermore required a crisis trigger (the occupation of the Ruhr).

Another thing to understand is that Weimar Germany saw hyperinflation because its heavily expanded money supply was suddenly juxtaposed against a halt of economic production. That matters because, if a national economy becomes ten times smaller overnight, it can have the same effect as making the money supply ten times too big — and the U.S. in 2020 is nowhere close to replicating that experience.

Our base case is for real inflation pain to be felt when the vaccine-powered growth boost starts to wear off. But again, when will that be? And what will the gold price do in the meantime? If the mid-1970s are any measure — another inflationary period when the U.S. experienced growth coming out of a recession — the gold price could fall by a lot as interest rates rise faster than inflation.

In a sense we wholly agree that trillions of dollars in stimulus, combined with a massive spike in money supply growth, amounts to a wild experiment that could end quite badly.

It’s the timing of inflation’s arrival we dispute, because official inflation measures could oscillate between “moderate” and “problematic” for months to come, if not years — which would mean now is not the time to be bullish on gold. And as for when that time comes — let the charts tell you!


The EV Bull Market is Over

By: Justice Clark Litle

4 years ago | News

“Because I used to love her,” the Rolling Stones sang, “but it’s all over now.” The electric vehicle (EV) bull market is officially over, too.

The EV bull market — which some would call a bubble, or even a mania — has shuffled off its mortal coil. It is neither resting nor pining for the fjords; it is now an “ex” bull market.

We can say this with clarity because Tesla — lord on high of the EV manor from the start — has officially entered bear market territory.

The standard threshold for bear market status is a 20% price decline from the last market peak. Once that level is triggered, by popular convention the stock retains bear market status until a new closing high is made; upon reaching that high, a fresh bull market begins.

As of Tuesday, Feb. 23, TSLA closed 20.9% down from its Jan. 26 high — good for a bear market trigger. The prior bull run is thus now in the books; a season of the bear has begun.

In terms of what makes a bear market, the 20% threshold is somewhat arbitrary. There is nothing magical about a drawdown of that size.

On the other hand, the threshold has to be set somewhere — for the sake of defining a universal standard — and 20% seems as good a level as any.

Then, too, in regard to the EV bull market, Tesla was actually one of the last names to crack.

In the table below, we tallied a dozen high-profile EV plays ranked by recency of all-time highs; as you can see, every single name is in bear market territory (and a handful have outright imploded).

As the topping dates indicate, the EV bull market is not only over, it has been over for a while now. The EV highfliers started losing altitude months ago; and Tesla was merely one of the last to crack.

Bear market status does not mean the bulls have to quit, however.

It is possible — and perhaps even likely — that TSLA and other EV names with ultra-devoted followings see a follow-on rally move in an attempt to reignite bullish sentiment.

We saw some of this when the ARK Innovation ETF, symbol ARKK, went from being down nearly 12% at one point on Feb. 23 to closing out with losses of just 3.30%.

ARKK, the $27 billion flagship ETF for the ARK family of funds, saw record share turnover of $4.96 billion in a single day, according to Bloomberg, with ARK founder and technology investing legend Cathie Wood indicating her team was “buying the dip” in Tesla.

“Corrections are good, they keep us all humble,” Wood said, adding that “The strongest bull markets I’ve been in are built on walls of worry.”

Well, maybe. But it isn’t a bull market anymore — for the EV space at least — and at some point, the worries become justified. With the 20% downside threshold broken for most, if not all, high-flying EV plays, near-term bull rallies driven by cheerleading fund managers won’t count from this point forward, unless strong enough to help these names reclaim their 12-month highs.

That means lower highs will likely be paired with lower lows — the basic definition of a downtrend (lower highs and lower lows in extended succession).

That rule of thumb is in line with how bear markets tend to work psychologically: Those who are bullish on a stock (or a whole industry group) may refuse to abandon it after the first big drop, and may even attempt to bid the shares up after a second sharp price decline or even a third.

The bulls’ failure to reestablish an upward trend, however — and the tendency of hopeful efforts to fail — can ultimately wind up helping the bears. 

Another problem EVs face was illustrated by Workhorse (WKHS), one of the biggest decliners in the EV space, when WKHS plummeted on news of a single missed contract.

“Electric-vehicle maker Workhorse Group Inc. plunged on Tuesday,” Bloomberg wrote, “triggering multiple trading halts, after a key U.S. Postal Service contract that some had expected it to win went to rival Oshkosh Corp. instead.”

There are only so many U.S. Postal Service vehicle contracts to go around; the demand source for government vehicle upgrades is limited.

One could say, in fact, that the demand for EVs in general appears limited relative to the glut of car automakers offering EV products — and that glut is only set to grow larger.

General Motors is determined to go all-electric down the road, with Volkswagen, Ford, Jaguar, and others joining them — and even Apple appears dead serious about entering the fray with an Apple Car by 2024. And there are still more EV automakers — like Rivian, a competitor backed by billions from Amazon — waiting to go public.

In our view, this flood of new EV competition, along with a sharply reduced footprint for consumer vehicle-buying — think municipally-owned self-driving car fleets servicing high-traffic urban areas, and a generation of new drivers who never bother with owning a car at all — will lead to a quasi-universal “demand cliff” that makes it hard for most industry players to turn a profit.

EV share prices tumbling over their own demand cliff may already be reflecting this state of affairs. And to the degree Tesla bulls pin their hopes on Chinese demand, we can only shake our heads: As we explained on Feb. 11, the Chinese government could cannibalize or destroy Tesla’s local market share at any time (and has logical strategic motives for doing so).

For tech stocks in general, the broader threat is that, as goes one of the most high-profile areas of the market, so goes speculative appetite everywhere else. The Nasdaq can attempt a strong rebound along with other tech stalwarts, but if risk appetite leaves the EV space, it may leave tech entirely.

This isn’t to say that everything in the market looks bearish. As Bloomberg noted yesterday, the S&P 500 Energy Index is on track for its strongest month ever in respect to S&P 500 outperformance.

That is the reflation trade at work, and investor capital flowing out of overvalued tech names (powered by the assumption of forever-low interest rates) and into growth-driven names with an old-economy flavor.

The distant future (in the form of electric vehicles) is not so easy to bet on when financing has a cost (due to rising long-end yields) and real alternatives actually exist: The “true believers” in the future of EV technology may be missing this point entirely, as the bear case at this point is rooted in valuations and macro-driven interest rate changes and the supply-demand picture, not the general adoption curve of electric vehicle technology.

In TradeSmith Decoder we are watching the EV space closely — along with the ARK family of funds, various IPO- and SPAC-related ETF vehicles, and over-inflated tech names generally — as speculative opportunities that could soon be worth shorting.

The basic idea, once a clear bear trend has begun, is to wait for a hope-driven rally to fizzle out, and then short as the rally fails. Instead of “buy the dip,” one could call it “sell the rip” — a sort of buying the dip in reverse.

As Jesse Livermore once said pseudonymously via Reminiscences of a Stock Operator, there is only one side to be on in the stock market, which is neither the bull side, nor the bear side, but the right side. Increasingly for EVs and other highfliers — Tesla now among them — bear season has finally arrived.


Speculative High Flyers are Rapidly Losing Altitude

By: Justice Clark Litle

4 years ago | News

On Friday of last week we said:

“There is a formidable bearish case for overvalued technology stocks moving forward, and it is only getting stronger by the day.

“The bear case has to do with interest rates at the long end of the curve, and the willingness of the Federal Reserve to sit back as long-end yields (the 10-year and the 30-year) start to rise.”

On Monday, Feb. 22, the markets took heed, with various high flyers falling hard.

Perhaps most notable was Tesla (TSLA), which dropped nearly 9% in a single day. Other single-day decliners included Peloton (PTON), down nearly 10%, and DoorDash (DASH), down nearly 14%.

So was Monday, Feb. 22, a rough day for markets overall? No, it depended on how you were positioned.

Energy stocks surged, with XLE, the bellwether energy stocks ETF, up nearly 3.5%; and financial stocks surged too, with KRE, the bellwether regional banking ETF, up more than 2%.

Energy stocks and financial stocks went up, on the same day high flyers got hammered, because the long end of the curve is doing its work. Also on Monday, the U.S. 10-year and 30-year yields touched pre-pandemic highs of 1.37% and 2.19% respectively.

As we have explained repeatedly in these pages, the case for Buzz Lightyear valuations — “To infinity and beyond!” — is predicated on perpetually low interest rates. If you change that equation, the valuations are no longer sustainable.

On Feb. 22, legendary hedge fund manager Ray Dalio published a think piece to ask and answer the question, “Are We in a Stock Market Bubble?”

His answer: It depends on which names you are talking about. “There is a very big divergence in the readings across stocks,” Dalio said. “Some stocks are… in extreme bubbles (particularly emerging technology companies), while some stocks are not in bubbles.”

Dalio then noted the extreme bubble stocks represented about 5% of the top 1,000 U.S. companies by market cap, making them a kind of “Nifty Fifty” for the new era.

(The original Nifty Fifty comprised a group of stocks deemed “no-brainer” or “one-decision” investments in the 1960s and ’70s, known for wildly high price-to-earnings ratios prior to crashing and burning.)

For TSLA, a psychologically critical support level is $650 per share. Why $650? Because TSLA closed at roughly that level on Dec. 21, the day the company joined the S&P 500.

In December 1999, a company called Yahoo! — the exclamation point was part of the name — joined the S&P 500 index, and a few months later reached an all-time high valuation of $140 billion. (Seventeen years later, Yahoo! would be scooped up in a fire sale at less than 5% of that amount.)

The December 1999 inclusion of Yahoo! into the S&P 500 also marked the top for the whole bubble, or something very close. It was roughly three months later, on March 10, 2000, when the Nasdaq 100 peaked above 5,000.

We mention Yahoo! — not for the first time in these pages — because the S&P 500 parallel feels uncanny. If Tesla follows the Yahoo script, the all-time high could be in; and if the Nasdaq follows the 1999-2000 script, the high for the 2020-vintage “Nifty Fifty” complex could be on the books too, with a fudge factor of weeks relative to the March 2000 top.

It is very hard, if not definitively impossible, to know when a raging bull market will end. But there is a difference between making the call in advance, as based on assumption or conjecture, and observing a breakdown in price action alongside a series of bearish events.

As we finish this note, CNBC is reporting that December home prices rose 10.4% — the largest jump in seven years, according to Case-Shiller Home Price Indices.

At the same time, a Bloomberg economist survey foresees 4.9% U.S. GDP growth in 2021 — a pace more normally associated with emerging markets — and Morgan Stanley is forecasting $70 Brent crude (another 8 to 10% price rise from current levels) by the third quarter. 

Then, too, in the past week or so, we have seen headlines like this:

  • “U.S. is Poised to Beat China’s V-Shaped Recovery, JPMorgan Says (Bloomberg)”
  • “Blue-Collar Jobs Boom as Covid-19 Boosts Housing, E-Commerce Demand” (WSJ)
  • “Midwest Labor Markets Shake Off Covid-19 Downturn” (WSJ)
  • “U.S. economy may have its best chance in years to break from era of subpar growth” (Washington Post)

“Midwest cities such as Columbus, Ohio, have had some of the most resilient job markets during the pandemic,” the Wall Street Journal adds. “Indianapolis, Minneapolis, and Cincinnati joined Columbus as having among the lowest unemployment rates of 51 major metro areas at the end of last year…”

We should also note that, for some observers, the U.S. GDP estimate of nearly 5% is on the low side; Goldman Sachs expects 7% growth, which would be the biggest U.S. expansion year since 1984.

The point of revisiting this growth litany is that economic growth can sustain higher yields at the long end — particularly if the short end is held at zero — and the Federal Reserve is likely to allow an ongoing rise in 10-year and 30-year treasury yields.

If Columbus, Indianapolis, and Minneapolis are looking good, that further steepening of the yield curve — which, by the way, is like manna from heaven for bank stocks — can continue until something breaks.

And as investors rotate heavily back into reflation plays — energy stocks, financials, industrials, construction plays, airlines, travel and leisure, and so on — the prospect of further carnage looks strongest in the “Nifty Fifty” group Ray Dalio referenced.

Then, too, the electric vehicle (EV) and special-purpose acquisition company (SPAC) niches may warrant close attention.

EV companies are (or were) a white-hot center of speculation, with the SPAC structure serving as the perfect grifter spaceship vehicle: When putting, say, an EV and a SPAC together, you get a combination that is pure nitroglycerine.

Perhaps it is no surprise, then, that Churchill Capital Corp IV (CCIV) — a blank-check SPAC that just confirmed a much-anticipated EV acquisition, and had previously sported a $15 billion market cap — is down nearly 50% in early morning trading as we finish this note, and TSLA is sub-$650, too.

As a final note, the really unsettling thing about the EV exodus (and the move away from tech stocks generally) is the possibility for a new “market structure” event to quickly unfold, over the course of the coming days or even by the time you read this. Short sellers provide an under-appreciated service to markets by covering their positions on the way down, which means buying when everyone else is selling. When short sellers are mostly absent, as they are for most of the high-flyer names, there is a greater risk of air pockets (via no one left to buy) as longs head for the exits.


Because of Texas, a Historic Infrastructure Bill Now Looks Inevitable

By: Justice Clark Litle

4 years ago | News

Imagine the world as a ball-shaped scoop of ice cream, sitting upright in an ice cream cone.

The polar vortex is a circular flow of low-pressure cold air swirling around the top, or dome, of the ice cream scoop. This low-pressure air flow is held in place by a ring of high-pressure warm air that surrounds it like a doughnut. 

When the jet stream weakens, the ring of warm air that keeps the cold air in a circle around the dome gets broken, allowing the low-pressure cold air to spill outward and downward.

Imagine chocolate syrup or butterscotch topping dripping from the top of the ice cream scoop down onto the sides; now picture cold air from the polar vortex, spilling out and down as a weakened jet stream fails to contain it, enveloping much of Europe in January and, last week, hitting Texas.

This is how parts of Texas came to be colder than Alaska over the course of the past week. A circular flow of freezing-cold air — normally contained at the top of the cone — spilled out and down over the sides of the world like butterscotch drizzled onto an ice cream scoop, reaching all the way to San Antonio.

There is no historical record for the polar vortex behaving like this (spilling out over its sides and reaching all the way down to Texas). As such the Lone Star State is used to episodes of extreme heat, but not extreme cold.

Texas was, in fact, warned about a decade ago that its energy grid was unprepared for extreme cold.

“Federal regulators warned Texas that its power plants couldn’t be counted on to reliably churn out electricity in bitterly cold conditions a decade ago,” Bloomberg reported on Feb. 17, “when the last deep freeze plunged 4 million people into the dark.”

“They recommended that utilities use more insulation, heat pipes and take other steps to winterize plants,” Bloomberg added — “strategies commonly observed in cooler climates but not in normally balmy Texas.”

For whatever reason, Texas decided not to winterize in February 2011 (or at any point since). That decision now looks catastrophic.

As the Texas cold-weather crisis (now spreading to surrounding states) initially unfolded, some people hastily blamed frozen wind turbines.

But trying to pin the disaster on wind energy is silly: For one thing, wind accounts for less than 25% of the Texas energy mix, and other, more heavily relied upon sources — like natural gas and nuclear power — also failed disastrously in conditions of extreme cold. For another thing, wind turbines do just fine in freezing-cold temperatures if installations are winterized properly. Just ask Minnesota, Sweden, Denmark, or any of the other snowy places that rely on wind energy each winter.

The catastrophic stories now pouring out of Texas guarantee this story will receive sustained national attention.

In addition to dozens of deaths directly attributed to extreme cold — along with Texans being forced to sleep in their cars with the motor running, or burn furniture for heat — new waves of outrage were created as wholesale electricity prices shot higher by as much as 10,000%.

In the deregulated Texas energy market, consumers can be directly exposed to wild swings in electricity prices with no cap on costs. That is how Scott Willoughby, a 63-year-old Army veteran living on Social Security, wound up with a $16,752 electric bill charged to his credit card.

Tens of thousands of Texans, if not hundreds of thousands, will be looking at monthly electricity bills in the range of 50 to 70 times the expected cost.

The wild price-gouging is legal under the fine print of deregulated energy costs — it’s in the fine print of the contracts that were signed — but this explains why the current Texas system will not survive politically. Public outrage will almost certainly kill the current arrangement. Catastrophic power shortages are one thing; sky-high bills authorized in the fine print are another; when both are put together, the result is collective consumer rage.

And this brings us around to front-month copper prices, which surged by an astonishing 4.43% in a single day on Friday, Feb. 19.  Four-percent-plus might be small beer for, say, a speculative technology play, but it is gargantuan for a global base metal like copper.

On that same day, the blue chip copper miner in the TradeSmith Decoder portfolio more than doubled copper’s single-day percentage performance, rising by more than 9.8%; that core holding was up more than 257% as of the Feb. 19 close.

In our view, the copper price threatening to go parabolic was a function of what’s happening in Texas.

The connection runs through infrastructure and the growing political inevitability of a major infrastructure package making its way through the U.S. Congress.

The Biden administration had already been planning to push the most ambitious infrastructure overhaul in decades, with a size and scope to rival any initiative since the Federal Highway Act of 1956. Now, in the aftermath of Texas and the change in political climate (no pun intended), they will be tempted to go even bigger — and their plans will likely resonate with the American public.

One of the biggest concerns relating to the polar vortex incident, and the Texas cold-weather catastrophe, is that it could happen again next winter, or the winter after that. Apart from another brutal cold snap, Houston could soon experience more extreme floods, of the kind it has faced repeatedly over the past few years.

The point is that we can no longer count on  the “100-year storm” actually taking place every 100 years; we are now at the point where 100-year weather events seem to take place routinely.

With the latest run of events in Texas — and with the pain spilling out to surrounding states — Americans are experiencing the catastrophic costs of underpreparation in the most visible and painful way.

The way to respond to all this — or at least the given lines of response in Washington — will be to: 

  • Build out America’s decrepit infrastructure, which, according to routine professional assessments, has been in a state of neglect and disrepair for decades.
  • Winterize, weatherize, and otherwise upgrade America’s energy grid (including the Texas grid, which is separate and on its own system), in order to head off the potential costs of future catastrophic weather events (which are becoming more and more frequent in occurrence).
  • Rethink and revamp the approach to deregulated utility markets, in Texas and wherever else, as such that consumers don’t get gouged to the point of financial disaster even as the providers themselves are experiencing catastrophic delivery failures. 

All of this is going to cost many, many trillions — and state budgets are more or less busted at the tail end of the pandemic, which means the federal government will need to foot the bill.

Under normal circumstances, there would be significant political pushback in Washington at the notion of rolling out a series of mind-bogglingly expensive infrastructure initiatives on par with Eisenhower’s national highway system, or even Roosevelt’s public works projects of the 1930s.

Now, though — largely thanks to what’s happening in Texas — the political appetite for resisting an infrastructure overhaul for the ages will be much diminished.

Who wants to argue with the visceral imagery of millions of Texans freezing in the dark, with no water in their toilets, as ongoing shortages evoke the specter of a failed state?

The infrastructure story will also play into the economic growth story, in our view, as the infrastructure package that is coming will place deliberate emphasis on the creation of millions of new jobs.

All of this spending and allocating and job-creating can be expected to deliver one heck of an inflationary wallop — but not right away, as we will explain in future pieces. The unfolding narrative of “growth first, inflation later” will be key for investors to grasp as various asset prices react.


A Big Reason to be Wary of Big Tech

By: Justice Clark Litle

4 years ago | Investing Strategies

“The only reason to be bearish… is there is no reason to be bearish.”

That is the view of Michael Hartnett, Bank of America’s Chief Investment Strategist, as recently expressed in a note to clients.

In our view, there are reasons to be bearish. It just depends which assets one is looking at, and the nature of the bear case being applied.

Take high-flying technology stocks, for example. There is a formidable bearish case for overvalued technology stocks moving forward, and it is only getting stronger by the day.

The bear case has to do with interest rates at the long end of the curve, and the willingness of the Federal Reserve to sit back as long-end yields (the 10-year and 30-year) start to rise.

Picture a seesaw, which is more or less a lever balanced on a fulcrum.

At one end of the seesaw, you have speculative risk appetite. At the other end of the seesaw, you have low long-term interest rates.

When long-term interest rates go down, speculative risk appetite goes up. That is the seesaw at work. If the economy is flat and money is getting pumped in, this logic applies all the more.

When funding is cheap and the cost of capital is near zero — conditions that are often (but not always) present when long-term rates are low — return-hungry investors tend toward one of two responses.

They either seek out lottery-ticket-style assets — with the potential for a large payoff tied to distant future events — or they pay a fat premium for predictable growth assets in a low-growth world, of the sort provided by the cash-rich tech juggernauts (Apple, Google, Facebook, and so on).

The problem is that, if long-term yields start to rise, the seesaw effect goes into reverse.

As long-end yields go up, the case for speculative fervor erodes, because a rising cost of capital makes it harder to fund projects geared 10 or 20 years into the future.

Also as long-end yields go up, the extreme valuations attached to the tech juggernauts become impossible to justify.

Take a market darling like Apple (AAPL) for example, which has inflated valuation issues we’ve discussed before in these pages (though it is certainly not alone):

  • AAPL is currently valued at a price-to-sales (P/S) multiple of 7.4x.
  • From January 2010 to January 2020, AAPL’s highest ever P/S multiple was 5.2x.
  • AAPL’s lowest P/S multiple in the January 2010 to January 2020 period was 2.2x.

When the price-to-sales multiple expands, it means investors are paying more for every dollar in revenue.

It doesn’t mean a larger quantity of revenue, stronger profit margins, or fatter cash flows. It just means investors are willing to value the same results at a higher premium than before.

The price-to-sales multiple for Apple, a juggernaut worth more than $2 trillion, has swollen to astonishing levels not because Apple is growing quickly, but because tech giants are the new safe havens, and risk-averse investors have few other names to buy.

The problem here is that, were AAPL to revert to back to a 5.2x P/S multiple — its top-of-range showing for the prior decade — the stock price could decline almost 30%, even with Apple’s underlying business staying exactly the same.

And were AAPL to revert to a 2.2x P/S multiple — it’s bottom-of-range showing for the prior decade — the share price would register a decline of 70%, even with the underlying business staying the same.

When valuation multiples become inflated by way of investor overcrowding in a low-interest-rate world, it is like pumping extra hot air into a balloon. If the extra hot air is removed, the size of the balloon will shrink — perhaps by a lot — even if nothing else changes.

This is why, in August, we explained how “Big Tech is the Zero-Coupon U.S. Treasury Substitute.”

The idea was that big tech had grown so popular as a parking place for cash, the valuation premium had swelled to the point where share prices were keying off macro developments more so than underlying changes to the business.

To put it another way, the valuation of Apple (and its fellow tech juggernauts) has been so artificially swollen by the low-rate, low-growth macro picture, all one has to do is sufficiently change that picture — by, say, introducing rising yields at the long end of the curve, coupled with real prospects for inflation — to see the valuation multiples for Apple and other big tech names fall, perhaps by a lot.

Because the big tech names have a macro profile comparable to Zero-Coupon Bonds (ZCBs)— in the sense of being safe-haven plays where nearly all the payoff comes at the end — it makes sense to check in on what actual Zero-Coupon U.S. Treasuries have been doing.

ZROZ is the ticker for the Pimco 25+ Year Zero Coupon U.S. Treasury ETF. If you wanted exposure to zero-coupon treasuries — which are like normal bonds but far more sensitive to interest rate changes — you could get it via ZROZ.

You wouldn’t want that exposure at the moment, though, because ZROZ fell more than 21% within the past seven months and looks poised to fall even further.

Why are ZCBs falling like a stone? Because long-term interest rates are rising. The U.S. Treasury 30-year bond yield is at its highest levels in a year.

And why are long-term interest rates rising?

Because the U.S. economy is in growth-and-recovery mode, and fiscal stimulus will accelerate the recovery further via elevated consumer spending, increased business confidence, and a resurgence of commercial lending.

What’s more, we don’t have to wait for evidence of recovery coming in hot; the evidence is already here.

“U.S. retail sales surged in January by the most in seven months,” said Bloomberg on Feb. 17, “beating all estimates and suggesting fresh stimulus checks helped spur a rebound in household demand following a weak fourth quarter.”

“It was the first monthly gain since September,” Bloomberg added, “and all major categories showed sharp advances.”

Consumers are already spending again, and the next big round of stimulus — $1.9 trillion worth — hasn’t even hit household bank accounts yet.

Then, too, as we explained earlier this week, America is winning the vaccine race — and evidence is mounting on that front as well.

“COVID-19 vaccine manufacturers and U.S. officials have accelerated their production timelines and signaled that the spigots are about to open,” said Bloomberg on Feb. 18, “providing hundreds of millions of doses to match the growing capacity to immunize people at pharmacies and mass-vaccination sites.”

If the pace of vaccination soon doubles — to more than 3 million Americans per day — confidence will increase on that front, too.

And speaking of confidence, how about this: “CEO confidence in U.S. economic outlook reaches 17-year high,” a Fox Business headline reads.

“U.S. business leaders expect to cut fewer jobs and a growing number plan to sharply raise employees’ pay in the months ahead,” says Fox Business, “as confidence in the economic outlook surges amid the rollout of COVID-19 vaccines…”

Not only will the U.S. recovery build strong momentum (this is already happening), in our view the extra trillions in fiscal stimulus, at least for the first few months or quarters of 2021, will be absorbed by the U.S. “output gap,” which is roughly defined as the amount of slack between current productive output and maximum productive output.

What that means in plain English is that we are likely to see growth without inflation for at least a little while — or growth with a moderate amount of inflation, in low-enough amounts for the Fed to wave off.

That, in turn, means long-term interest rates will be able to rise further, and the Federal Reserve will be fine with it. Rising long-term rates are not a problem if coinciding with real growth.

The kicker is that all of this is terrible news for Apple, and every other heavily inflated tech stock, or speculative junk name, that is dependent on historically low long-term interest rates to justify a valuation that would otherwise make no sense.

Think of a balloon again — a big tech balloon — filled to near-bursting with excess hot air.

The “hot air” is vastly over-inflated valuation levels (note again the Apple price-to-sales multiple) predicated on the assumption of forever-low interest rates, forever-weak economic growth, and forever-low inflation.

All of those assumptions are short-sighted, and soon enough likely to be proven wrong.

The whole complex of overvalued assets in the market right now — as defined by investors paying too much for cash flows, or pie-in-the-sky future prospects — has the feel of a zero-coupon bond waiting to see its price get hammered by a growth-driven jump in long-end yields (which the Fed will not prevent).

Then, too, an accelerating recovery could be a double-or-triple-whammy for big tech because the prospect for gains in less-overbought reflation plays — where valuation multiples are closer to rational — could further suck capital out of big tech in a rotation for the ages. In sum, this means the best news for the U.S. economy in quite a while (early signs of a robust recovery, based on real vaccine success, with real growth now and inflation later) also means plenty of capacity for rising long-term interest rates — and rising rates could easily trigger a series of cascading bear market declines for tech investment vehicles, whether conservative or speculative, that are priced for yesterday’s low-yield, weak-growth, low-inflation world.


Crude Has Some Good Years Left (the Oil Age isn’t Over Yet)

By: Justice Clark Litle

4 years ago | Educational

“The stone age did not end because the world ran out of stones, and the oil age will not end because we run out of oil.”

The Economist attributed that pithy statement to Don Huberts, the head of Shell Hydrogen, in 1999.

According to New York Times columnist Tom Friedman, it was first said by Sheikh Ahmed Zaki Yamani, Saudi Arabia’s Minister of Oil and Mineral Resources from 1962 to 1986, as far back as the 1970s. 

Either way, this notion of the oil age ending — for reasons other than depleted oil supply — has been around a long time. The thought is either 20-plus years old or 40-plus years old, depending on the source.

In the 1999 Economist piece, Huberts seemed to believe oil’s demise was imminent.

“The moment when an experimental technology becomes a commercial one is hard to define,” The Economist wrote, “but the new interest of oil companies, car makers, and power-engineering firms — almost all the industries that have a stake in the business, in fact — is a sign that fuel cells are crossing the line. Now that the energy business thinks that fuel cells are coming, they probably will.”

Twenty-two years later, we are almost there — or at least getting closer. 

Today more than ever, there is reason to see the oil age is drawing to a close. From governments and the private sector alike, the signaling is hard to miss:

  • More than a dozen countries and 12 U.S. states — including China, Germany, the United Kingdom, California, and others — have announced plans to either ban the sale of new internal combustion engine (ICE) vehicles or require a switch to 100% zero-emission new vehicle sales over the next two decades, with the bulk of deadlines in the 2030-2035 range.
  • The U.S. government has mandated all U.S. government vehicles to be zero-emission by 2030; China maintains its lead as the biggest electric vehicle (EV) market in the world through licensing fees and subsidies that overwhelmingly favor electric vehicles over diesel or gas-powered cars. 
  • General Motors — one of the largest automakers in the world, with annual vehicle sales in the seven to 10 million range — has pledged to invest $27 billion in EV research and production by 2025 and to phase out ICE production completely, going all electric, by 2035.
  • Jaguar Land Rover, the luxury automaker with British roots now owned by Tata Motors, announced its Jaguar brand will be entirely electric by 2025; the entire Jaguar Land Rover line-up is slated to have e-models by 2030.
  •  
  • Bentley Motors, the iconic luxury automaker owned by Volkswagen, announced all Bentleys will be electric by 2030.
  • The euphoric stock market bubble that began inflating in 2020 — and easily qualifies as one of the grandest bubbles of all time — was largely centered around the EV space. While valuations in the EV space are beyond insane by rational standards — and will wind up crashing the euphoria itself is a marker of the transformational impact EV will have. (World-changing technology revolutions have a longstanding habit of funding themselves through bubbles.)
  • Climate change mitigation efforts and green energy initiatives are politically popular with the Millennial generation — which is far larger than the Baby Boomer generation — and efforts to go green are dovetailing with post-pandemic hunger for large-scale, FDR-style spending projects.

Natural gas could stick around because there are ways to make gas a zero-emission energy source; one can create “blue hydrogen,” for example, by using natural gas in the electrolysis process and capturing emissions for carbon sequestration.

For crude oil, though — long considered the world’s most important commodity — it truly looks like the days are numbered. The old saying was on point: The oil age will end with plenty of oil still in the ground.

Oil will stay unextracted, in part, because investors are sick of throwing money at the process. Investing in fossil-fuel related businesses has mostly been an awful experience for the past 12 years; you can see this in the chart below, which shows the spread between the SPDR energy ETF (XLE) and the SPDR technology ETF (XLK). 

In July 2008, the value of fossil-fuel related energy stocks relative to tech stocks peaked with the West Texas Intermediate crude oil price above $140 per barrel; from that point onward, old school energy versus tech has been downhill ever since. 

The beaten-down state of the energy sector reflects a lack of willingness to put money into new oil projects. What is the point when crude oil demand will soon enough be going away?

Crude oil production, like most forms of commodity production, is a long-range affair when it comes to upfront investment cost. New crude oil projects require cash flow trajectory estimates over a period of several years, if not a decade or longer.

As a result of this, nobody wants to invest in long-range exploration or production for large-scale crude oil projects anymore. There isn’t much point when a giant “demand cliff” for oil is coming — the severe drop-off in crude oil demand that will come on a schedule as a result of government mandates shifting away from ICE vehicles and automaker plans to go full EV. 

And yet, here and now in 2021, we would much rather invest in fossil-fuel related energy stocks than technology stocks. If you had to go long one and short the other, long oil stocks and short tech stocks would be the easy play.

Why are energy stocks a far more favorable play than technology stocks right now?

In part because energy stocks are still beaten down, as the XLE/XLK spread chart shows, whereas tech stocks have nosebleed valuations that are highly vulnerable to rising interest rates at the long end of the curve; and in part because a long-range, zero-investment outlook for oil is bullish in the medium term.

As the world prepares for a transition to electric vehicles, the paradox is that global oil demand will yet remain strong for years to come.

To put it another way, the EV hand-off will take a while; as a result, the world will need plenty of crude oil, not just for the next few years but likely until 2030 at least.

This telegraphed transition window creates a paradox. Oil demand is likely to remain strong for the foreseeable future, and yet investors will have little to no appetite for funding new oil projects (because of the demand cliff they can see in the distance).

That juxtaposition makes the medium-term oil outlook bullish, not bearish, because the global oil supply will start to feel constraints (due to lack of new investment) well before the demand picture tails off.

Then, too, climate change initiatives and government regulations meant to protect the environment are paradoxically bullish for oil prices, not bearish, to the extent they reduce the availability of new oil and gas supply and limit the reach of low-cost expansion.

When the Biden administration restricts oil and gas exploration on federal land, for example, they are helping the oil price more than hurting it by artificially constraining new supply; the same goes for stepped-up environmental regulations that shift marginal oil projects from viable to non-viable.

As strange as it may sound, we could even see oil prices above $100 per barrel at some point in the coming years. To see how, just picture a Middle East geopolitical flare-up; in the midst of a fiat currency crisis; after an extended run of global demand growth; with the humbled oil majors long having knocked their new production budgets down to zero.

Even as we finish this note, West Texas Intermediate crude is trading above $61 per barrel, with the global Brent crude benchmark above $63.

For the last decade or so, being bearish on beaten-down energy stocks, and bullish on world-beating tech stocks, has been a “no brainer” type stance; our hunch is that, for multiple sustained periods between now and 2030, the opposite will make sense.


America is Winning the Vaccine Race

By: Justice Clark Litle

4 years ago | Educational

America looks poised to come from behind, muster its formidable might, and win hands down — just as it has done before, time and time again, in various contests throughout the twentieth century.

But this time it isn’t about a World War, a space race, or an arms race; it’s about the vaccine rollout.

America winning the vaccine race likely means a faster U.S. economic recovery; an ability to delay inflationary consequences of aggressive fiscal stimulus (because vaccine-powered growth comes first); a strengthening U.S. dollar (and profoundly weakening euro); rising yields at the long end of the curve; an extremely bearish gold outlook (due to the aforementioned strong growth and rising yields); valuation trouble for overinflated tech stocks as the “low rates forever” paradigm disappears; a powerful tailwind for reflation-style economic recovery plays; and more.

The U.S. vaccine rollout is far from perfect. Worse, the cost of delay is measured in human lives. And yet, America is getting it done, and momentum is building in a positive direction.

The United States is doing a far better job than Europe at getting shots into arms — at a pace that is accelerating — and the vaccines being administered to Americans are more effective and versatile (better able to be modified in response to new COVID-19 strains).

America’s positive performance gap, which is now readily apparent and starting to grow, could ultimately create a vaccine advantage over Asia and emerging markets too, especially as new COVID variants wreak havoc and new surges of “lockdown fatigue” challenge countries that halted commerce to stop the virus.

Why is America pulling away in the vaccine race?

To simplify greatly, the United States has better logistical capability, more effective public-private partnerships, better vaccines via better science, and greater willingness to deploy fiscal resources.

These American advantages did not spring up overnight — rather they were built up over decades.

America’s logistics edge is a function of technology and commerce-related infrastructure; the public-private partnership edge is a function of longstanding cooperation between government agencies and the private sector (in America’s case, dating all the way back to the Manhattan Project and the Space Race); and the scientific research edge, built up through staggering amounts of private sector R&D and university collaboration over decades, is especially important, because America’s groundbreaking mRNA vaccine technology is well-suited to handling new COVID strains (and could further transform medicine as we know it, long after the pandemic is over).

For those familiar with U.S. history, the concept of late-breaking American dominance should feel familiar.

We have seen this movie before — particularly in regard to World War II, the Soviet-era Space Race, and the Cold War arms race.

In each of those cases, America started out confused and distracted, almost bumbling in a state of anxiety and panic, before focusing its economic might and industrial-technological capabilities to dominate rivals and ultimately win hands down.

The movie is happening again.

A saying often incorrectly attributed to Winston Churchill is, “You can always count on the Americans to do the right thing after they have tried everything else.” You can also count on America starting off at a snail’s pace but finishing like a champion. It is sort of the country’s signature move at this point.

In World War II, Japan thought it was attacking a weak and sluggish opponent when it bombed Pearl Harbor in 1941. And yet, by the end of the war, Japan had built 17 aircraft carriers, whereas America had built 141. And whereas Japan had produced about 4.1 million tons of merchant ship output over the course of the war, America had produced more than 34 million tons.

Then, too, while most of the powers involved in fighting World War II were exhausted by the end of the war, the U.S. was barely warming up.

America’s economic might was so vast that, by the end of World War II, the U.S. alone accounted for more than 50% of global economic output — and the country was still just rolling up its sleeves, marshaling the time, capital, and scientific resources to build an atomic bomb besides.

With the Soviet-era Space Race, it was a similar type of deal.

Following America’s success with the Manhattan Project, the Soviet Union had tested its own atomic bomb in 1949, which in turn meant that Sputnik I, the world’s first artificial satellite launched in 1957, was not just a matter of technological bragging rights. It was a potential doomsday delivery device.

So, what did the United States do? After hyperventilating a bit, America focused on the Space Race with full force — and put a man on the moon in 1969.

The end to the Soviet-era Cold War — marked by the fall of the Berlin Wall in 1989 — has a similar feel to it. The Soviet Union and America got into an incredibly expensive arms race; America spent the Soviet Union under the table; and now the Soviet Union no longer exists.

Over and over, America wins the long game through a combination of technological prowess, scientific know-how, and economic might. This isn’t an accident: It is a natural consequence of the country’s built-in advantages.

America, as a superpower, is unique in controlling two oceans, the Pacific on its left and the Atlantic on its right. Meanwhile the northern border is secured by mountainous regions heading into the terrain of close ally Canada, the southern border is easily defensible heading into the terrain of Mexico, and the coastlines are hard to attack due to protective geological features.

The United States, as a country, is a fortress. Within that fortress there are enough natural resources and commerce-and-technology advantages to make America an agricultural superpower, an energy superpower, a technology superpower, and a scientific research superpower, all combined. 

On top of all this, American democracy still works. It has gotten banged up and badly bruised, but it still functions, and U.S. institutions are resilient enough to heal and rebuild the trust they have lost.

The above factors matter for the vaccine race because they reinforce the reasons why the United States is not only the most powerful country in the world, but also the richest country in the history of the world.

The fact that the United States is so wealthy means the government can spend trillions of dollars in fiscal stimulus without destroying the bond market or eroding faith in the currency. (The currency crisis may come later, but the fact it can be put off, or possibly averted with future growth, is remarkable in itself.)

So, what we have, in terms of the pandemic, is a situation where American machinery is gearing up at an accelerated pace. To cite some recent data:

  • The pace of U.S. vaccinations has increased to 1.7 million doses per day.
  • The U.S. vaccine supply has recently increased to 13.5 million doses per week.
  • More than 400,000 pharmacies nationwide are set to participate in vaccine distribution.
  • A third vaccine from Johnson & Johnson — which requires only one dose, rather than two — is in the pipeline for potential authorization.

As Bloomberg columnist Noah Smith points out, 1.7 million doses per day is nowhere near fast enough relative to the pace that is needed. But that pace is accelerating, and it puts the U.S. ahead of nearly every other country in the world.

As of this writing, there are only four countries ahead of the U.S. in terms of vaccination rates per 100 people — Israel, the Seychelles, the United Arab Emirates, and the United Kingdom — and of those four, only the U.K. is comparably large in terms of population size. (At just 9 million people, Israel is smaller than the Los Angeles county metro area.)

Then, too, the U.K. has chosen to delay second doses (where the United States largely has not) and the U.K. is also relying heavily on the AstraZeneca vaccine, which is potentially far less effective than the Pfizer and Moderna vaccines.

Meanwhile it is important to remember how the United States tends to perform when faced with large-scale industrial challenges: In matters of logistics, technology, and mass-scale production, American output tends to start slow but then compound at a geometric rate, making the gap ever wider between the U.S. and its rivals.

This vaccine rollout advantage is far more important than many realize in part because, even for countries that escaped the worst of the pandemic in 2020, vaccination is the only lasting solution. Trying to avoid COVID through repeated games of lockdown whack-a-mole is not a sustainable approach.

For instance: Even in Asia and the South Pacific, where countries like Taiwan and New Zealand received praise for keeping COVID case counts near zero, the threat of new breakouts tied to new COVID variants looms large.

On Feb. 15, New Zealand’s most populated city, Auckland, had to go into strict lockdown mode for the first time since October 2020, due to the arrival of a U.K.-related COVID strain.

The late troubles experienced by New Zealand and other COVID success stories — where a country seems to have beaten COVID, only to see new flare-ups and lockdowns later — suggests the long-run benefit of preventive lockdown measures may only go so far. That in turn implies that the only true escape from COVID-related misery, once and for all, resides in a full vaccine rollout.

Imagine a scenario where it turns out that COVID is devilishly hard to stamp out — almost impossibly so — through lockdowns alone, with new mutations causing ongoing flare-ups for countries that lack access to scientifically advanced mRNA vaccines.

In a scenario like that, “lockdown fatigue” issues can gradually become severe, even in countries where citizens were patient at first. One can already detect signs of this in Germany, where a weary populace is getting increasingly sick of commerce-throttling COVID measures.

And in fact, we don’t have to imagine such a scenario, because it is already playing out in Europe. 

The slow pace of Europe’s vaccine rollout — due to a lack of cooperation among member states, trouble with production facilities, a lack of logistical funding, and other issues — have combined to make Europe highly vulnerable not just to lockdown-fatigue backlash, but also to new strains of COVID that are not handled effectively by second-tier vaccine candidates.

Vaccine rollout delays grew so bad in Europe that on Feb. 10 Ursula von der Leyen, the president of the European Commission, had to issue an apology.

“We were late to authorize. We were too optimistic when it came to massive production,” she said in remarks to the European Parliament, “and perhaps too confident that what we ordered would actually be delivered on time.”

In an interview with Süddeutsche Zeitung, a German newspaper, von der Leyen further added that “a country on its own can be a speedboat, the EU is more like a tanker.”  

Europe is extremely vulnerable to continued rollout delays on at least three fronts.

First, the need to respond to new COVID variants could be a serious problem if logistical flexibility is lacking and available vaccine quality is second tier; second, lockdown fatigue and civil unrest become bigger issues by the day the longer the rollout takes; and third, Europe could be running low on fiscal stimulus and lacks an appetite to do more (which could mean slipping into a new recession). Then, too, various emerging markets — and even perceived winners like China — will have a rocky road ahead if new COVID variants spoil their economic recovery trajectories.

Once again, the only real inoculation against this (no pun intended) seems to be widespread inoculation — possibly coupled with a healthy portion of the population that has already been infected — and the country that wins on those fronts, hands down, is — you guessed it — the United States.

If America stays true to form, the performance gap between the United States and the rest of the world will widen. Production and logistics and technology and scientific research advantages — combined with ample funding, concentrated focus, and American economic might — will get the U.S. to a state of collective immunity, and full-fledged economic recovery, faster than global rivals.  

That in turn means the U.S. economy should be able to recover faster and resume vaccine-powered growth in part powered by fiscal stimulus (helicopter money) in the pockets of service-sector workers, along with a burst of pent-up demand from consumers celebrating the end of the pandemic, even as the rest of the world (ROW) faces new headaches and late stumbles born of new and highly transmissible COVID variants.

And again, to reiterate our early point, if this outlook is correct, it could have strange and profound effects on the market. If America continues to win the vaccine race — and particularly if this happens as ROW stumbles on new variants — look for a stronger dollar, higher interest rates, a cratering gold price, potential weakness in technology names (which have overinflated valuations keying off slow growth and low interest rates), a renewed appetite for reflation investments, and more.

This paradigm shift, if it happens, will catch many by investors by surprise.