A reader once again challenged us to test our Stock State Indicator (SSI) strategy against a widely followed Wall Street strategy – the 200-day simple moving average (SMA) strategy.
We’re up to the challenge. Let’s get started.
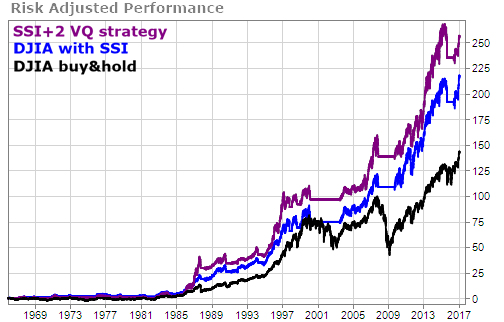
For the past few weeks we’ve been putting our SSI system to the test against buy and hold strategies on the Dow Jones Industrial Average (DJIA) over the past 50 years. We’ve shown that:
- Even following our most basic SSI strategy nearly doubles the percentage gain and more than doubles the reward-to-risk ratio;
- Adding our “add-to-your-winners every 2VQ’s” strategy makes the outperformance nearly absurd.
Here’s the chart to remind you where our current research results stand.
So … what exactly is a 200-day SMA strategy? It’s simple. You buy the DJIA when the price of the DJIA is above the 200-day simple moving average (SMA) of the DJIA. When the DJIA is below the 200-day SMA, you are out of the market.
Our SSI system is similar in that it is a trend-based strategy – which is why your fellow reader wanted to know if our SSI strategy outperformed the 200-day SMA strategy.
By the way, the 200-day moving average is calculated using 200 trading days, not 200 calendar days. Since there are approximately 250 trading days in a year, the 200-day moving average works out to just under 10 calendar months.
So let’s see how the DJIA has performed over time using both the 200-day moving average strategy and the two strategies that use the TradeStops SSI signals on a reward to risk basis:
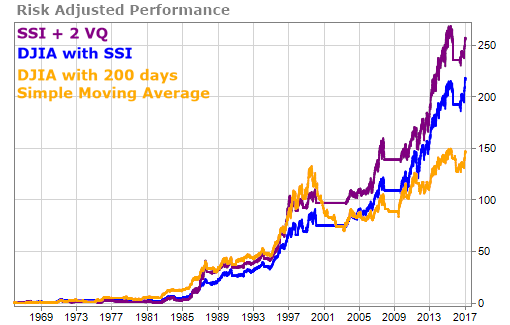
We think you’d agree the chart speaks for itself.
How about if we look at it just in terms of simple percentage gains? Here you go.
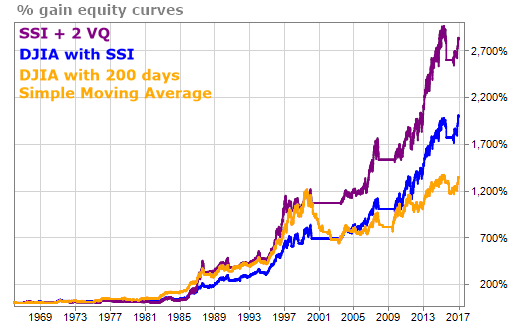
From 1966 until recently, both of the SSI strategies substantially outperformed the 200-day SMA strategy. While the 200-day SMA strategy returned almost 1300% during the period, the SSI strategy returned almost 2000% and the 2 VQ strategy returned around 2800%!
And … there were far fewer trades using the SSI strategies. The simple SSI strategy had only 19 trades over this 50+ year period, while the 2 VQ strategy had only 31 trades. The 200-day SMA strategy had 194 trades during the same timeframe.
Wow. We’re not usually one to toot our own horn… but we have to say, we’re impressed.
We hope you are too,
TradeSmith Team