R.I.P Bond Bull Market , 1981-2021
Something momentous happened on Friday of last week. The greatest bull market in history likely came to its end. We are not talking about the U.S. stock market, but the U.S. treasury bond market.
Before discussing what happened, let’s quickly revisit why the bond market is so important, and the way that interest rates work.
Stock market valuations and price-to-earnings multiples are largely a function of interest rates. When interest rates are falling over time, multiples tend to expand as the price of money becomes cheap. The easier it is to borrow at low rates, the better it is for paper assets, in terms of cheap capital supporting high stock-market multiples.
When interest rates are rising, on the other hand, multiples tend to contract (shrink) as the price of money becomes expensive. As yields go up, it gets harder for investors and businesses to borrow cheaply and to fund aggressive projects.
As a general rule, this means less capital available to support high price-to-earnings multiples. With less capital chasing asset returns, there are fewer bidders in the market, and so the multiples tend to shrink.
This is why, to a significant degree, we can say the bond market (which determines the level of long-term interest rates) drives the stock market.
Inflation expectations, or a lack thereof, determine the level of interest rates, which in turn determine whether the price of money (how much it costs to borrow) is cheap or expensive.
And the way that inflation expectations drive interest rates is by influencing the level of the bond market. When inflation expectations are low or falling, bond prices tend to rise as a general rule. When expectations are high or rising, bond prices tend to fall.
The yield on a bond is inverse to its price, which means that, as bond prices fall, yields go up. You can think of the price like a child sitting on one end of a see-saw, and the yield, or interest rate, as a child at the other end of the see-saw. As the bond price rises, the yield falls and vice versa.
This is a mathematical relationship because the “coupon” of the bond — the amount it pays out each year — is fixed.
Say a bond is issued with a coupon yield of 8%. This means that, if you buy the bond at “par,” meaning exactly 100% of the issue price — you will get $8 per year for every $100 that you invest, which works out to 8% exactly.
But now let’s say you buy the bond at 130, or 130% of the issue price. Now you are paying $130 for the same $8 coupon, which means your yield is reduced to just over 6%, because an $8 coupon is about a 6% yield on a $130 investment.
It also works in reverse: Say you are able to buy the bond at 80, meaning 80% of the issue price. In this instance you would get $8 of yield on an $80 investment, for a yield of 10%.
This is why, for the past 40 years, more or less, U.S. treasury bond prices have been going up, and then up some more, in the greatest bull market of all time.
The rise of the 30-year bond market is the flipside of the fact that U.S. interest rates have more or less been falling for four decades — ever since they peaked in September 1981.
We say the bond bull market was the greatest of all time — bigger than the multi-decade run in stocks — because in terms of which influences the other, the bond market is really the more important of the two.
It was a long-tail, multi-generational trend of falling inflation, falling interest rates, and rising bond prices (the flipside of falling interest rates) that enabled the stock market to do what it did.
Turning to the topic of last week, here is the momentous event: In the same week the American Rescue Plan was introduced, U.S. treasury bonds officially entered a bear market.
The official definition of a bear market is a 20% or more decline from the prior peak. Once bear-market status is triggered, the asset in question has to reach new highs before clearing the bear-market condition.
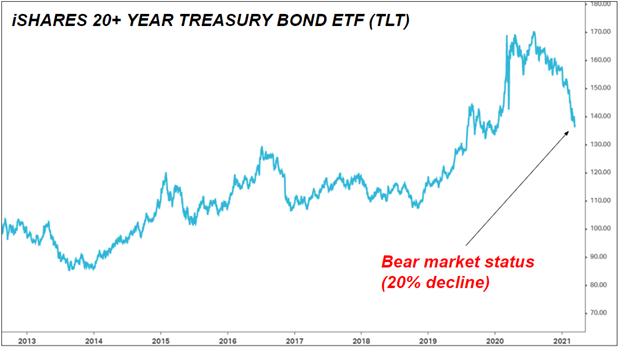
The iShares 20+ Year Treasury Bond ETF (ticker symbol TLT) triggered official bear-market status with its sharp drop on Friday (March 12).
- The TLT closing value on Aug. 4, 2020, was 170.26.
- The TLT closing value for March 12, 2021, was 136.06.
- The result is a decline of 20% — bear-market status.
You can see the visual result in the chart of TLT below. The impression is that of a large-scale top that completely erased the gains of the pandemic, and went on to eat into 2019 gains.
If this is well and truly “the end” of the U.S. treasury bond bull market, it will cap off a 40-year run, spanning the four-decade period of 1981 to 2021. It was September 1981 when interest rates last peaked and treasury bonds bottomed, setting the stage for a multi-generational rise in bond prices (and fall in yields) that took equities along for the ride.
It is true that, over the past 40 years, the treasury bond market has entered bear-market periods before. The last official bear market for TLT — as marked by a 20% or greater decline — was triggered in late 2013, with the bear condition clearing in December 2014.
This time, however, a new high (the mechanism for clearing bear-market status) may not be in store for a decade or two, if ever. It seems likely that the Aug. 4, 2020, high will go down as the all-time high of the cycle for U.S. Treasury bonds.
Why do we say this? In part because Goldman Sachs is now forecasting an 8% growth rate for the U.S. economy in 2021, with an unemployment rate below 4% by the end of the year.
Even if Goldman is off by a third, U.S. economic growth is likely to be incredible (as the preliminary numbers already show). And with that growth will come inflation pressures — of which there are already signs brewing — and there is a fair chance many of the “temporary” programs in the American Rescue Plan will prove wildly popular with the American public, and then be signed into law.
There are analysts who say any near-term burst of inflation will be “transitory” or “cyclical.” In our view they are misreading the political situation.
If the inflation level stays low, there will be no reason to stop or slow the successive waves of fiscal spending initiatives yet to come.
This means that, from here on out, a combination of political incentives and growth prospects will act like a one-way ratchet: An absence of inflation will, in and of itself, be a political justification for cranking the spending dial harder, until the point at which uncomfortable inflation, or even painful inflation, finally arrives.
Given this turn of events — born of the wild popularity of stimulus, and the likely “growth first, inflation later” mix now playing out before our eyes — we feel confident in saying that, with a very high likelihood, the greatest bull market in history is now over.
The U.S. treasury bond market had a fantastic run from 1981 to 2021, moving ever higher as interest rates fell toward the zero lower bound.
Then, too, interest rates worldwide, in falling toward zero, capped a trend of falling yields that has been in place for nearly 1,000 years, if not longer (dating back to the Middle Ages, or by some analyses even further).
But zero is the realistic floor (meaningful negative rates cannot be sustained), and governments are now stepping up with a fiscal spending zeal not seen since World War II — and on various measures exceeding World War II.
R.I.P. Bond bull market , 1981-2021. A new era, of rising yields and rising inflation pressures, is here.