Why should investors pay attention to cycles? For the same reason farmers pay attention to seasons.
To maximize the harvest, a farmer has to know the given season — and the seasons are a four-part cycle that repeats year after year. It would make no sense for the farmer to try and harvest crops in the spring (or plant them in the fall).
Investors, too, have actions that apply to given cycle points. But investment cycles are shaped by human behavior as much as earth’s orbit around the sun, which makes them messier and harder to pin down.
Then, too, investment cycles don’t follow a fixed calendar pattern in the sense of repeating routinely year after year. Some investment cycles are multiple years long; others can be multiple decades long. This adds to the challenge of cycle awareness, and adjusting behavior accordingly, for what the cycle says about the given trajectory of markets at a given point in time.
A classic example of cycles thinking is found in the old commodities saying: “The best cure for high prices is high prices.” That saying also works in reverse: “The best cure for low prices is low prices.”
What the saying implies is that every cycle has a tendency to reverse itself. The conditions that create a cycle point extreme — like the arc of a pendulum swinging far in one direction — are the same conditions that ultimately reverse and retrace the pendulum’s path, causing it to lose momentum, halt, and swing back the way it came.
When applied to most commodities, high or low-price extremes have a direct impact on human behavior. The behavior change then shapes the cycle in a kind of self-perpetuating feedback loop. When a typical commodity becomes expensive or cheap in the extreme, for example, the following behaviors occur:
- High prices encourage a flood of new supply. Existing producers expand their operations, new producers come to market, and consumers cut back on their use of the high-priced commodity or look for substitutes. This activity combination causes prices to peak and eventually fall.
- Low prices encourage a sharp reduction of supply. Existing producers cut back their operations or go bust, with few or zero new entrants to an unattractive market, even as consumers step up their use of the low-priced good. This combination causes prices to bottom and eventually rise.
The commodities example shows the human behavior component of cycles. In a free market system, price discovery functions as a signal, with producers and consumers adjusting supply and demand in response to that signal. This causes the price to journey between high and low extremes and back again.
And yet, cycles would still exist even in the absence of market price — and in fact, cycles would exist in the absence of human behavior entirely. The back-and-forth nature of cycles, with the metaphorical pendulum tracing a path between extremes, is embedded in nature itself.
We can see this by way of the Lotka-Volterra equations, also sometimes known as the predator-prey equations, which in turn drive the predator-prey model. The Lotka-Volterra equations can help us understand why cycles show up not just in farming or in markets, but everywhere. Mother Nature, it turns out, is a fan of boom and bust.
Alfred James Lotka was an American mathematician, physical chemist, and statistician who lived from 1880 to 1949. He proposed the earliest version of the Lotka-Volterra model, relating to self-starting chemical reactions, in 1910.
Lotka’s work was expanded on by Vito Volterra, an Italian mathematician and physicist, who lived from 1860 to 1940. Volterra was further inspired by his future son-in-law, Umberto D’Ancona, who was a marine biologist studying fish catches in the Adriatic Sea.
In the 1920s, with the help of a brilliant Russian thinker named Andrey Kolmogorov, the Lotka-Volterra equations were expanded to include “organic systems,” like ecosystems populated by plant and animal species. From this point, observations in nature confirmed the validity of the Lotka-Volterra equations, and the predator-prey model was born.
Without getting into the math — which involves symbolic notation and differential equations — we can observe that the predator-prey model revolves around three basic inputs: Predators, Prey, and Grass.
The predators eat the prey; the prey eat the grass; and the grass grows back quickly or slowly, or not at all, depending on how fast it gets eaten. These three inputs — predator, prey, and grass — are all you need for a self-sustaining cycle.
For the sake of example, let us say the predator is the Canada Lynx, a form of wildcat, and the prey is the Snowshoe Hare, a form of rabbit the lynx finds very tasty. In a simplified version of the model, here is what happens:
- The hare population booms thanks to a rich diet of grass.
- The lynx population also booms via plenty of hares to eat.
- The grass supply grows scarce, due to a glut of hares eating it.
- At the same time, there are lynxes eating hares left and right.
- These pressures cause the hare population to shrink.
- At this point there is a “bust” — a hare population collapse.
- A lack of grass, plus lots of predators, reduces the number of hares.
- The lynx population, now starved for food, collapses too.
- The reduction of the hare population is a respite for the grass.
- In the absence of too many hares, the grass becomes plentiful.
- At this point, the cycle repeats from step one.
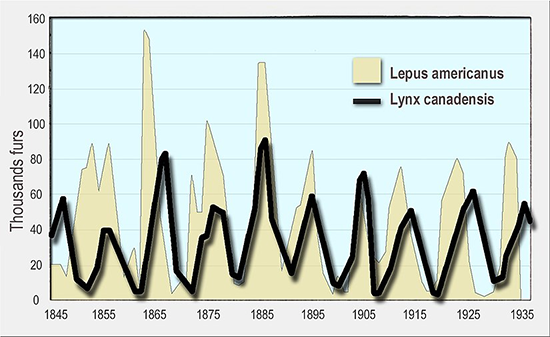
We can actually see this boom-bust pattern via recorded data from the Hudson’s Bay Company, which sold lynx and hare fur pelts in large quantities between 1845 and 1935. You can see the peaks and troughs of the cycle pattern, via total number of lynx and hare furs sold, in the Wikipedia chart below.
 |
Note that the relationship between predator, prey, and grass, as described here, creates a form of ecological balance.
If the hares were allowed to completely run wild, they would arguably eat all the grass and then starve, at which point the hare population would drop to zero. The lynx population regulates the hare population, which in turn keeps the hares from wiping out the self-replenishing grass.
In the absence of some disturbing outside factor, the Lotka-Volterra equations describe a predator-prey relationship that can cycle indefinitely (as long as energy from the sun keeps nourishing the grass). The cycle simply repeats, over and over again, with highs and lows in the lynx and hare population self-correcting through natural means.
The key thing to understand here is that, while the Lotka-Volterra equations describe a steady long-term relationship, there is a natural boom-bust rhythm within that steady long-term pattern. On a month to month or season to season basis, the hare population could be booming — or it could be busting, depending on the particular cycle point and various interrelated factors.
This is how markets behave too. Investors have the potential to greatly improve their long-term results by understanding this dynamic, and we are broadening and deepening our research efforts here at TradeSmith to track and explain the cycles that truly matter.
TradeSmith Research Team