We showed you last year how the SSI stock price signals crushed the S&P 500 for almost 20 years. How did they do during the lost decade of the 1970s?
One of our TradeStops members, Harold R., recently sent us an email wanting to know how the TradeStops SSI system would have done 40-50 years ago when the markets went nowhere for a long period of time.
We wanted to know that answer too.
Many of you have seen the study we did demonstrating that by simply applying the SSI stock signals to the S&P 500, you could have crushed the returns S&P 500 itself.
Here’s the most recent chart that shows these results.
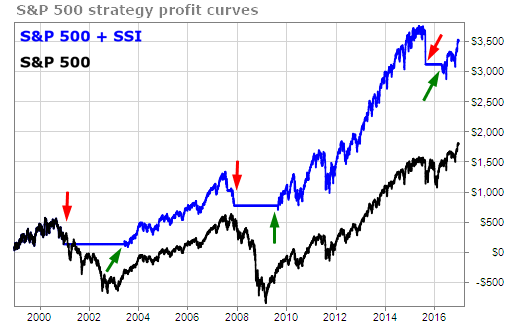
At the time, we explained that the meat of the outperformance came from avoiding the huge losses from 2001-2003 and 2008-2009. We called that “winning by not losing.”
The investment landscape of the late 1960s through the early 1980s was much different than today’s landscape. The stock market basically went nowhere with the DJIA first closing above 1000 in 1972 and then falling back and not crossing the 1000 mark for good until 1982.
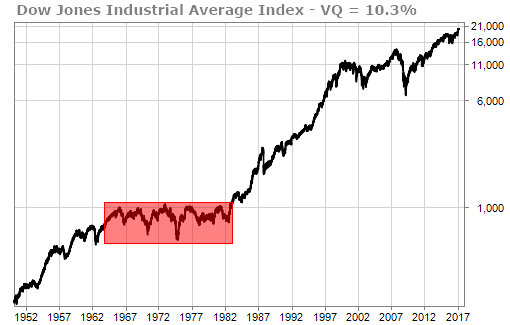
So how did the TradeStops Stock State Indicator (SSI) signals fare during this lost decade?
Incredibly well!
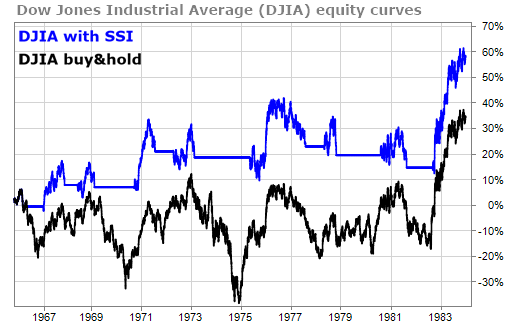
The black line is the DJIA and its historical movement. The blue line is the DJIA according to the TradeStops SSI stock signals. This is another great example of “winning by not losing.”
During this period of time, the DJIA was mostly in negative territory, but by using the SSI signals, an investor would have had a positive return the entire time.
At the end of 1983, using the SSI stock signals, an investor could have been up almost 60% vs. only 35% for buy and hold. This is a significant difference during a difficult time for investors.
It required a lot of patience to invest during this period of time. Had we been using the SSI signals, we would have been out of the market and waiting in cash half the time (of course, we could have made a nice return on cash as interest rates were a lot higher then).
Another thing we like about this chart is that for most of the time, as new SSI Entry signals were triggered, they did so at higher levels than the previous times. Only once did the SSI plateau at a lower level.
In a difficult environment for investing, the TradeStops SSI signals greatly outperformed the underlying index.
TradeSmith Team