We’re often asked the question, “Can the TradeStops Volatility Quotient (VQ) help with covered calls?” Today, we’ve got the beginnings of an answer to that important question.
Covered calls are a popular strategy for generating income from your existing portfolio and doing so with limited risk. If you own 100 shares of Walmart, for example, you can sell a covered call option against your Walmart shares. Here’s how it works.
Walmart is currently trading around $68 per share. There are options buyers out there right now who are willing to pay you $1 per share today ($100 total for your 100 shares) if you will give them the right to buy Walmart stock from you at $70 per share any time before April 21, 2017.
This options “contract” is known as the “April 21, 2017 $70 call” on Walmart. The “strike price” is $70 and the expiration date on the contract is April 21, 2017. The $1 per share that you receive equals 1.47% extra income that you’ve generated from your Walmart stock on top of any dividends you will receive.
As an owner of 100 shares of Walmart, you can sell one of these contracts and your contract is covered in the sense that if the the buyer of the contract exercises the right to buy the shares from you, then you’re covered because you already own the shares.
If Walmart trades above $70 per share before April 21, 2017 then you will likely have to give up your 100 Walmart shares for $70 per share.
So … hopefully you can now see that if you’re an investor looking to sell covered calls, it would be great to be able to find just the right covered call to sell that would maximize your income or profit while minimizing the likelihood that you will end up having to sell your existing shares.
That’s the challenge we set out to investigate.
To do so we decided to use the S&P 500 going back over 50 years to 1965. The first question that we asked ourselves was how many days, on average, did it take for the S&P 500 to move one VQ?
Just looking back over the bull market of the past 8 years, you can get an idea of what I’m talking about. The chart below shows how many calendar days it has taken the S&P 500 to move up one VQ for each leg of this bull market.
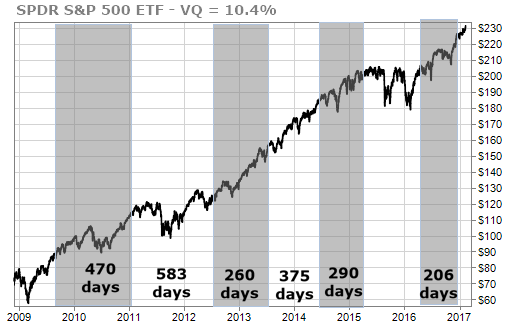
We also asked how long it took, on average, for the S&P 500 to move ½ VQ as well as ¼ VQ. The answers were 115 days and 65 days respectively.
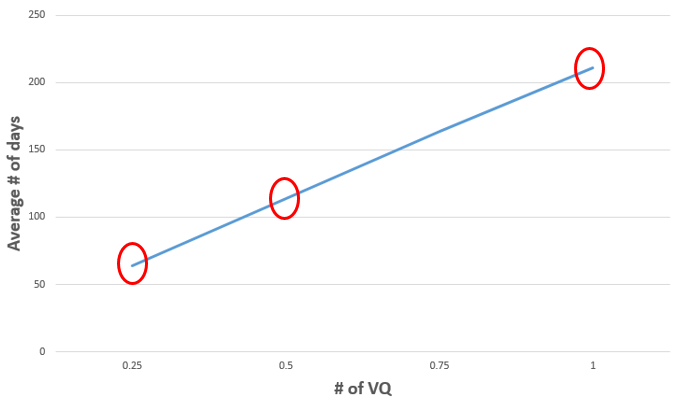
The following chart shows the three data points that we found. ¼ VQ = 65 days. ½ VQ = 115 days and 1 VQ = 210 days … and then we drew a line in between these three points.
Our goal is to find a way to capture as much income as we can and still have a better than 50% likelihood that the call options we sell will expire worthless (and we’ll get to keep our shares).
Many investors like to sell options that expire 30-60 days in the future. This allows them to easily manage their option trades. Using this criteria, we could sell a call on SPY with a strike price that is ¼ VQ out-of-the-money, 65 days in the future, and there is a slightly greater than 50% chance that the call will expire worthless.
Here are a few details if we wanted to execute this strategy.
SPY is trading at about $232.50. With a current VQ of 10.4%, that means ¼ VQ = 2.6%. When we multiply the current price of SPY by 2.6% we get $6.05. So we’d be looking to sell a call that expires about 65 days in the future and for which the strike price is $6.05 “out of the money.”
To find a call option with that strike price we take the current price of SPY ($232.50) and add $6.05 to it to get a strike price of about $239. Looking 65 days into the future puts us right at about the April 21, 2017 monthly options expiration date.
Thus, our optimum covered call to sell would be the $239 strike price with an April expiration. Currently, that call is selling for around $1.04 which is additional income of 0.45%. That’s a 2.6% annualized return.
SPY currently has a 2.29% dividend yield so it’s possible to effectively double the income generated from SPY by using this strategy.
We could also go out about 115 days, or 4 months, in the future and sell a call with a strike price that is ½ VQ, or about $12 out of the money. And if we wanted to try to maximize the capital gain in our trade, we could sell a call on an option that is a full 1 VQ, or $24, out of the money and expires in 8-12 months.
We think that this is pretty exciting research and we know that many of you will find it very exciting as well. It’s not yet available as a service in TradeStops but we did want to let you know the direction in which we’re thinking.
If you have feedback on this research, we’d love to hear it.
TradeSmith Team