Last week we talked about Going Green … i.e., buying on strength when we see the Stock State Indicator (SSI) change from red to green … and not even waiting for a pullback.
This week we’ve got some compelling examples of just how profitable “going green” can be.
It’s every investor’s dream to buy a stock at its exact low and sell it at its exact high. But that’s all it is…. a dream. It might happen once or twice in your investing career, but it will be the exception, not the rule.
The TradeStops SSI system is designed to give investors the best opportunity to:
- Buy a stock that is in an easily-identifiable uptrend,
- Know how much room you need to give the trend to run and;
- Sell the stock after the uptrend has been broken.
The SSI system was designed to capture large multi-year moves higher in stocks and funds by patiently waiting for big uptrends to begin and then making sure that we can hold on until the uptrend is broken.
The beginning of such uptrends is best captured when a stock or fund moves from the Red Zone of the SSI into the Green Zone.
It’s not easy for a stock to make it from the Red Zone to the Green Zone. To do so, a stock has to cross two major hurdles. First, it has to have a big bounce off of a bottom … a bounce that is greater than what you’d normally expect from a whole year of volatility for the stock. Second, it’s SSI Trend Line needs to turn decisively positive.
What we’ve found is that once these two conditions have been met, the stocks can move higher for a long time … as long as you give them enough room to run.
A classic example of the kinds of opportunities that the SSI system is targeted to capture is Northrop Grumman Corp (NOC). NOC bottomed in August of 2011 at a low of around $46 per share. By the time it triggered a new SSI Entry signal (i.e., the SSI changed from red to green) in April of 2012, it was already up nearly 20% at $55 per share.
Before we show you the chart of what has happened to NOC in the past 4 years, you have to stop for a minute and think about what you would do today if you saw a relatively conservative stock like NOC already up 20%. Many of us would say, “Well, that one got away from me already.” Right?
Wrong.
Two years after triggering its SSI Entry signal, NOC was up another 100% to $110 per share … and today NOC sits above $210 per share. That’s nearly a 300% gain after the stock had already been up 20%!
The following log-scaled chart tells the whole story.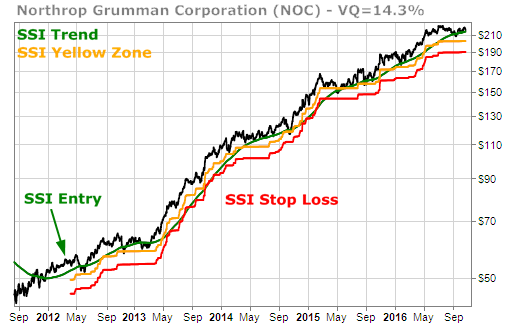
Another great example is Fiserv, Inc. (FISV). FISV gave a green SSI Entry signal in February, 2012 at about $33 per share. As of October 2016, FISV was up almost 200% at about $100 per share.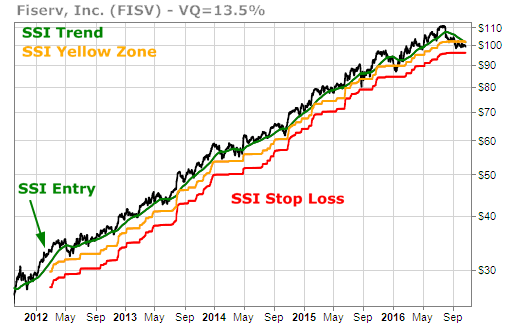
What’s particularly striking about FISV is that it didn’t even cross into the SSI Yellow Zone until August of 2015 – a period of nearly three and a half years!
Will these stocks eventually lose steam and stop out? Of course they will. But we don’t know when that will happen … and we don’t need to know. The SSI will tell us when the current uptrend is broken.
Capturing large multi-year trends with gains of hundreds of percent (and the benefit of long-term capital gains tax treatment) is exactly what TradeStops and the SSI was designed to do.
The best indicator we’ve ever seen for identifying the start of such trends is when the SSI changes from red to green.
To crazy gains,
TradeSmith Research Team